Skip to content
Home
About
The Editors
The Paul A. Baran—Paul M. Sweezy Memorial Award
Privacy Policy
Magazine
__________
Subscribe
Back Issues
Archives
__________
Submit an Article
My MR Subscription Account
My MR Press Store Account
Contact
Press
Help
Donate
MR Online
SEARCH
Home
About
The Editors
The Paul A. Baran—Paul M. Sweezy Memorial Award
Privacy Policy
Magazine
__________
Subscribe
Back Issues
Archives
__________
Submit an Article
My MR Subscription Account
My MR Press Store Account
Contact
Press
Help
Donate
MR Online
Close Menu
Books
Authors
On The Site
Also in this issue
U.S. Imperial Strategy in the Middle East
The U.S. Prison State
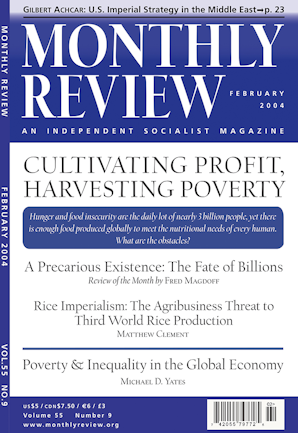
Rice Imperialism: The Agribusiness Threat to Third World Rice Production
A Precarious Existence: The Fate of Billions?
Manufacturing the Love of Possession
Books by Michael D. Yates
The Political Writings of Bhagat Singh
Edited by Chaman Lal and Michael D. Yates
Work Work Work
by Michael D. Yates
Why Unions Matter
by Michael D. Yates
Can the Working Class Change the World?
by Michael D. Yates
The ABCs of the Economic Crisis
by Fred Magdoff and Michael D. Yates
Article by Michael D. Yates
'Ballad of an American': The Illustrious Life of Paul Robeson, Newly Illustrated
Panopticon
These Brothers Chose Well
COVID-19, Economic Depression, and the Black Lives Matter Protests: Will the Triple Crisis Bring a Working-Class Revolt in the United States?
It's Still Slavery by Another Name
Nothing to Lose but Their Chains
Thinking Clearly about the White Working Class
'Mourning and Militancy'
Measuring Global Inequality
On Henry Giroux: Foreword to 'America's Addiction to Terrorism'