Often have a share in their misfortunes.
Only a few years ago it was widely suggested that the capitalist economy had entered a new economic era. The rapid economic growth experienced during the brief period of the late 1990s, we were told, would become virtually endless, spurred on by rising productivity led by high-technology and the New Economy. The circumstances that now confront us following the bursting of the speculative bubble could not be more different. The country is once again mired in economic stagnation. In the present “recovery”—if indeed we can call it that—new jobs remain few and far between. Of the four sources of demand that create economic activity—personal consumption, business investment, government spending, and net exports—it is mainly consumption, backed by increasing debt, that is currently keeping the economy from slipping deeper into stagnation. Indeed, many business leaders and economists fear the return of recession—referred to as the likelihood of a “double dip.” Behind this fear lies excess capacity in almost every industry, the absence of new growth stimuli, slow growth or recession in most of the rest of the world, and the aftereffects of the bursting of the speculative stock market bubble. All of this suggests that there is more at stake than the traditional business cycle. At the very least, there is reason to expect the continuation of the tendency of stagnation.
The Unemployment Picture
The chief indicator of this sorry situation is to be found in the realm of hiring, which is in its worst slump in almost twenty years. Since the recession began in March 2001, the U.S. economy has lost more than two million jobs (New York Times, February 6, 2003), with many of the losses occurring as mass permanent layoffs from large companies. Although official unemployment has remained steady at about 6 percent over the last year, many workers have been unemployed for extended periods while many others have given up actively looking for work and are no longer counted among the officially unemployed, although they are without work and desire jobs.
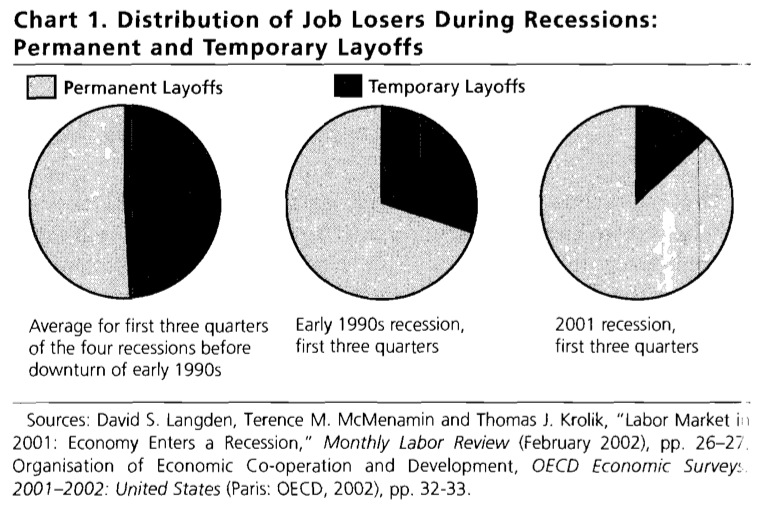
In the four recessions preceding that of the early 1990s, the proportion of job losers who lost their jobs permanently was about equal to those losing them on a temporary basis (see chart 1). Thus workers losing their jobs permanently averaged 51 percent in the initial phase of the four recessions prior to 1990, while in the recession of the early 1990s the percentage of those permanently laid off—increased to 70 percent. In the initial phase of the 2001 recession the share of permanent layoffs increased even further, to 87 percent. This near disappearance of temporary layoffs as a factor in unemployment means additional hardship for workers who are thrown out of work, and greater fear of job loss among those still employed, putting downward pressure on wages.
Another indication of the dire employment situation at present is the record of mass layoffs (layoffs involving at least 50 persons from a single establishment). In November 2002 alone there were 2,150 mass layoff events involving 240,000 workers. In the fourth quarter of 2000, 58 percent of those individuals that had lost their jobs in mass layoffs were associated with layoffs lasting more than thirty days. By the second quarter of 2002 (the latest date for which complete data is available) more than two-thirds (68 percent) of workers associated with mass layoffs had been jobless more than thirty days.*
There has been a general upward trend in the percent of all unemployed (not just those occurring through mass layoffs) that are out of work for an extended period. The ten-year average of those unemployed that have been without jobs for more than fifteen weeks went from less than 20 percent in the early 1970s to 26 percent in the early 1980s, 28 percent in the early 1990s, and 30 percent in 2003 (Bureau of Labor Statistics, U.S. Dept. of Labor.)
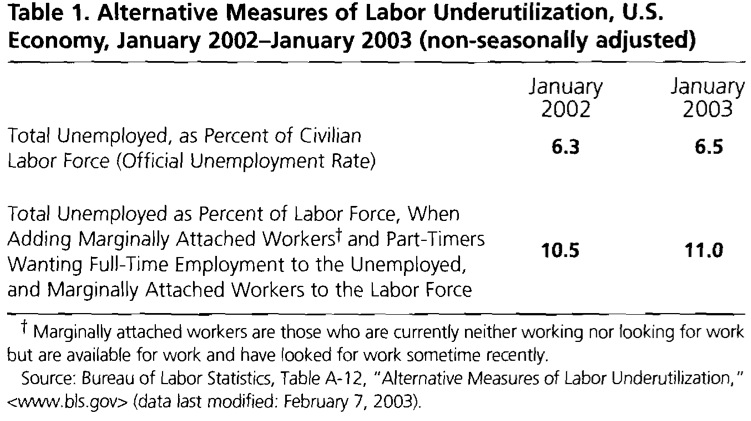
Workers facing the pain of long periods of unemployment with limited prospects of finding a job commonly give up on active job searches and are no longer counted as belonging to the officially unemployed. In other words, they fall deeper within what Marx called “the reserve army of labor.” After years of criticism by labor unions and progressives, the Bureau of Labor Statistics finally acknowledged the problem in the October 1995 issue of its Monthly Labor Review and now brings out a report on alternative measures of labor underutilization. In January 2003, official unemployment (defined as the total number of unemployed as a percentage of the sum of those looking for work plus those currently working) was 6.5 percent (non-seasonally adjusted). However, when those who have recently dropped out of the labor force, as officially defined, and those who are working part-time but desire a full-time job, are added to the number of officially unemployed, the level of unemployment can begin to be seen in its true proportions. By this measure there was a (non-seasonally adjusted) real unemployment rate of 11 percent in January 2003, compared with 10.5 percent a year earlier (see table 1). This means that there are over 6 million people that have no jobs and want full-time work even though they are not officially considered to be unemployed!
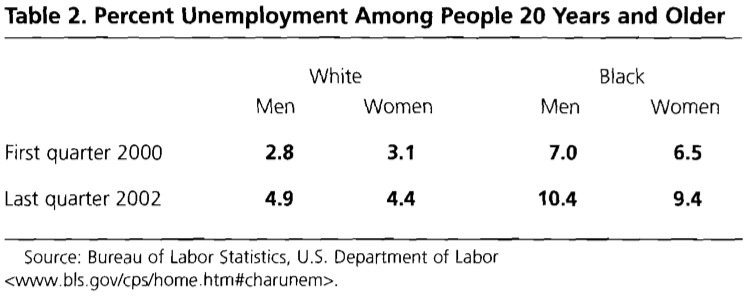
The burden of unemployment invariably falls disproportionately on people of color. As shown in table 2, the official unemployment rate of black men and women twenty years and older in the last quarter of 2002 was more than twice that of their white counterparts. For black men the level of official unemployment at the end of last year was 10 percent. Since black workers gained disproportionately in relation to whites during the years of low unemployment rates (a fact celebrated in the latest Economic Report of the President), the sharp increase in black unemployment is all the more obvious now. An unemployment rate for black men and women that was twice that of their white counterparts was one of the main manifestations of institutional racism in the early 1960s prior to the main Civil Rights victories. Little has changed in that respect in the intervening decades.*
Increasing unemployment and stagnating wages are reflected in growing numbers of homeless and hungry individuals and families. The U.S. Conference of Mayors reports that “…during the past year requests for emergency food assistance increased by an average of 19 percent, with 100 percent of the cities registering an increase.” (A Status Report on Hunger and Homelessness in America’s Cities 2002, December 2002). With regard to the homeless, the Conference of Mayors likewise found that “During the past year requests for emergency shelter increased in the survey cities by an average of 19 percent, with 88 percent of the cities registering an increase. A recent story from New Hampshire gives some of the human dimensions of the so-called “jobless recovery” coupled with decreased federal assistance to the poor: “Rising layoffs, rent and fuel prices mean tough times for New Hampshire food pantries. More people are coming in for help, and fewer are coming in with donations” (AP story, Burlington Free Press, March 2, 2003). As the welfare director of Pittsfield, New Hampshire put it: “My welfare [total requests] are triple…last year. I get guys who are laid off and at the end of their benefits, they’ll come in with their kids and wife and ask what I can do. Well, one thing I can do is feed them.”
How the Economy Keeps Going
The great irony in these circumstances is that the U.S. economy is being propelled forward in the present weak recovery largely by growth in personal consumption, even as real wages are declining. The main factor holding up consumption is borrowing on the basis of increased home values—or a housing bubble. With the stock market and many other investment opportunities appearing unattractive, significant amounts of money have shifted into real estate, driving up prices. The Federal Reserve, which has cut interest rates twelve times in the last two years in order to encourage investment, has stimulated this trend. As The Economic Report of the President, 2003 acknowledged, “Housing prices… rose much more quickly than the median household income in 2001,” which left the ratio of the prices of houses to the income of households at its highest level in decades (p. 44). Many would-be new homeowners are unable to purchase houses selling at high prices and are faced with higher rental prices. Meanwhile, homeowners have responded to the combination of increased home values and low interest rates by borrowing massively against their home equity, primarily to maintain their consumption. Refinancing totaled $2.5 trillion in the last two years alone. It has been estimated that in the third quarter of 2002, on an annualized basis, Americans drew $320 billion more out of the equity in their homes than they reinvested in real estate. Only about 39 percent of homes in the United States are owned free and clear and the remaining homeowners are carrying average debt burdens in excess of 80 percent of the value of their homes. This means that “many Americans have little margin of safety should home prices level off or should they fall as much as 20%, as they did in many overheated areas in the late ’Eighties.” (Jonathan Laing, “The Debt Bomb,” Barron’s, January 20, 2003). Indeed, the housing bubble may well be stretched about as thin as it can go without bursting. Stephen Roach, chief economist and director of global economics at Morgan Stanley, recently detailed the dangers of this situation:
The equity [stock market] bubble helped to create other bubbles—most notably in the housing market and in consumer spending. Their continued existence poses a serious threat to lasting expansion….There is good reason to believe that both the property [housing] and consumer bubbles will burst in the not-so-distant future. If they do, there is a realistic possibility that the United States, like Japan in the 1990s, will suffer a series of recessionary relapses over the next few years. Yet denial remains deep, just as it was when the Nasdaq composite index was lurching toward 5,000. Few want to believe that this economic expansion may be built on such a shaky foundation (“The Cost of Bursting Bubbles,” New York Times, September 22, 2002, Op-Ed page).
Even without a decrease in housing prices, there are indications that people have stretched their credit so far that expansion of consumer debt may not be able to continue at the same pace. One indication is that the household debt-service burden (household debt-service payments as a percentage of disposable personal income), has risen from about 12 percent a decade ago in the early recovery phase of the business cycle to around 14 percent today at the same phase in the cycle.* One thing is certain; the amount of debt relative to ability to pay cannot keep going up indefinitely. A reflection of this is the recent increase in personal bankruptcies, which hit a record of over one and a half million in 2002 (New York Times, February 15, 2003).
This dependence of the economy on bubbles in housing and consumer spending becomes more alarming when it is recognized that the other sources of demand are faltering. The real locomotive of a capitalist economy is capital accumulation or investment. Yet, business fixed investment in the United States declined at an annual rate of 3 percent in the first three quarters of 2002, largely due to a precipitous decline in investment in structures, which fell by almost 18 percent. This collapse of investment in structures is mainly a result of the overbuilding of commercial structures (office buildings, hotels, shopping malls, etc.) during the financial bubble in the late 1990s.
However, it is not just office buildings that are in oversupply, but also industrial plant and equipment. “Many observers,” The Economic Report of the President, 2003 tells us, have raised the question as to whether the economy is faced with “a capital overhang, built up by excessive investment in the years immediately before the 2001 recession” (p. 35). What is undeniable is that there has been a rise in overcapacity in plant and equipment on a scale not seen for decades. Preliminary estimates for manufacturing capacity utilization for 2002 place it at 73.8 percent, its lowest level since 1983 (Ibid., p. 339). Investment in new productive capacity is governed by expected profits to be obtained on this investment sometime in the future when the new capacity is to come on line. When expectations of future profits on investment are low, due to a shortage of markets or some other reason, investment simply stops. Corporations are particularly leery of investing when they are already facing large amounts of idle productive capacity, because new investment will only add further to an existing mountain of excess capacity. Normally, investment only gathers steam if steady increases in final consumption seem well assured. But if consumption is faltering or on precarious foundations, and existing productive capacity is already sufficient to more than satisfy current and prospective needs, investment opportunities are extremely limited.
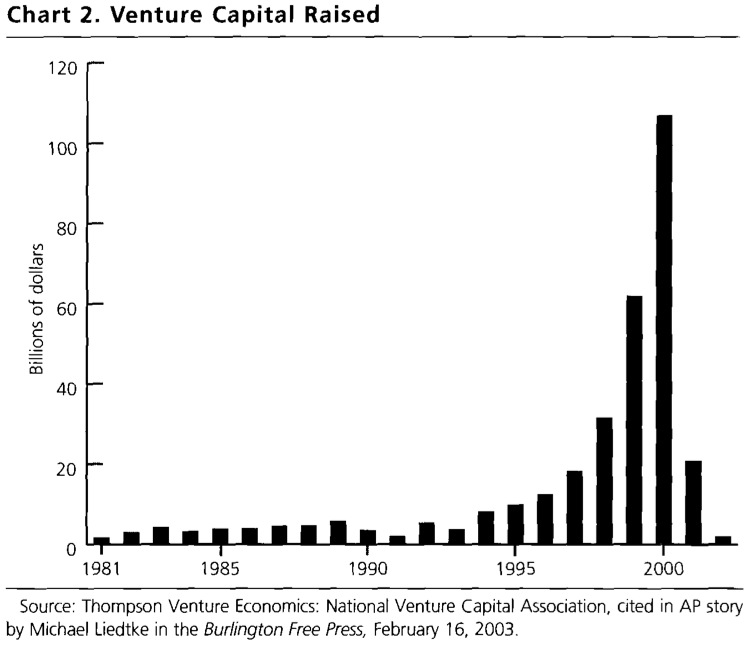
To be sure, new investment can result from what Keynes called “animal spirits”—irrational, volatile investment behavior often induced by speculative fervor.* But “animal spirits,” in this sense, are not to be counted on and can vanish as quickly as they first appeared. This is evident in chart 2, which shows the enormous volatility of venture capital during the information technology-financial bubble of the late 1990s and the consequences when the bubble burst. The result was mass unemployment of information-technology and financial-sector workers and a huge excess capacity in telecommunications and other high-tech industries. Despite the continuing technological advances associated with the digital revolution, investment in these spheres remains vulnerable to the same problems of overcapacity that have plagued the entire history of capital accumulation.
The Keynesian revolution in economics taught that when there is a downturn in the business cycle, government spending should step in to stimulate the economy. To a limited extent this has been occurring. The federal government, mainly due to the boom in military spending associated with its global War on Terrorism, increased its real purchases of goods and services by an annual rate of 6 percent in the first three quarters of 2002. State and local government purchases, however, only rose by an annual rate of about 2 percent in the same period. As a form of fiscal stimulus, the total increase emanating from government is still too small an amount to have much effect on the overall economy. State and local purchases in particular are likely to decline drastically in the months ahead since so many states and localities are trying to avoid going bust.
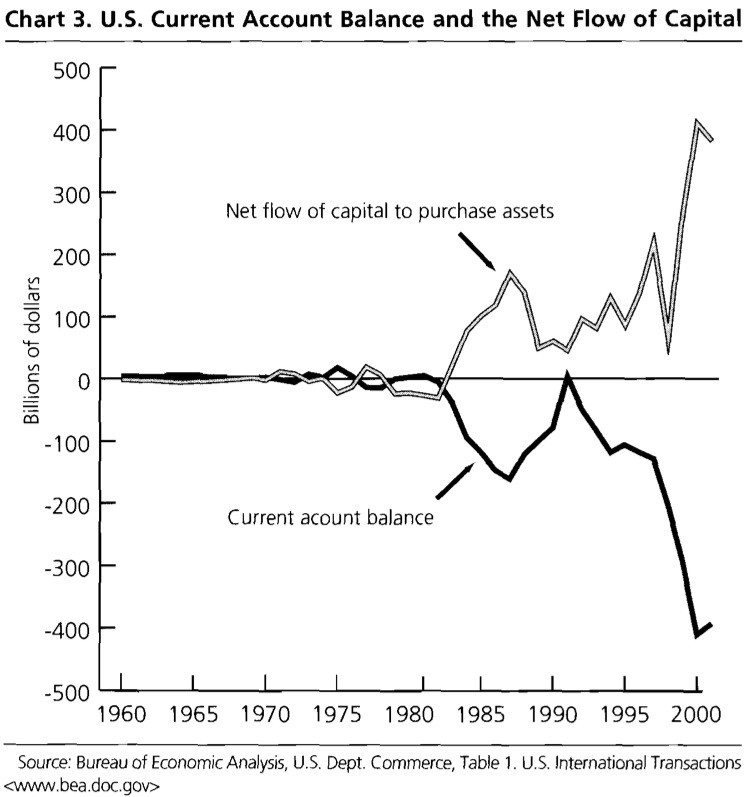
For many years imports into the United States have far exceeded exports, resulting in a potentially serious problem for the U.S. economy. During 2002, imports of goods and services rose faster than exports, resulting in a record $435 billion trade deficit ($77 billion greater than the previous year). The U.S. current account deficit, a good part of which results from the deficit in the trade in goods and services, was about $400 billion in 2001 and will most likely come in at well over $500 billion for 2002. For over a decade, the trend has been toward increasingly larger current account deficits (chart 3).
National trade and current account imbalances are hardly new. But they take on different forms in different countries. Deficits are most common in third world economies due to the exploitation by the rich countries. Servicing third world debts and the transferring of profits of multinational corporations to the core countries has to be paid in international currency. Thus, there is a push to enhance exports or take on new loans to gain dollars or other internationally accepted currencies. The very flow of investment and aid from the core countries, including that of the IMF and the World Bank, leads to further dependency on the centers of power and to debt peonage.
So how does the U.S. get away with massive deficits in their economic relations with the rest of the world? It has not done so by printing more dollars. (That could cause rampant inflation and wreak havoc at home and abroad.) Rather, it is the hegemonic position of the United States in the world economy, the leading role played by the U.S. dollar, a skyrocketing stock market, and financial derivatives that have allowed it to borrow heavily and attract investment from the rest of the world. As seen in chart 3, a net inflow of capital into the U.S.—to the tune of hundreds of billions of dollars a year—has been needed to balance out its current account deficit. How long it will be able to continue to operate in this way is an open question, and depends on the power relations—which are not set forever—within the world capitalist economy as a whole.
The current account deficit has been paid by foreign investors who buy U.S. Treasury Bonds, speculate in the stock market and artificial financial creations such as derivatives, buy real estate and merge or acquire firms, or build their own businesses in the United States. “But in 2001,” according to Business Week Online (March 18, 2002), “foreigners switched to buying bonds, which place a heavier burden on the U.S. because they require interest payments. Last year, 97% of the U.S. current account deficit was financed by net foreign purchases of bonds other than [U.S. government] Treasuries.” This is creating a new source of fragility for the U.S. economy, since the increasingly short-term nature of the credit financing the deficit means that it is likely to be more volatile. What is certain is that the ongoing expansion of the American imperium, including wars and the spread of U.S. military bases and commitments abroad, may result in a massive additional outflow of dollars. If so, the likely result will be a further undermining of the U.S. current account, and a more precarious international financial situation for the United States as well as the rest of the world economy.
The intersecting nature of the problems facing the U.S. economy is evident in the fact that a large amount of the Treasury Securities—issued by the U.S. government when it spends more than it receives in taxes—are purchased by foreign sources. From 1992 to 2001 foreigners have increased their share of ownership of the U.S. national debt from about 17 percent to 31 percent (Federal Reserve Board, Flow of Funds Accounts, Table L.209.) The current U.S. administration’s policies (primarily the military build-up) are causing massive increases in budget deficits, necessitating the issue of large quantities of new Treasuries. Consequently, the willingness of foreigners to purchase and hold these securities has become critical to the stability of the U.S. economy.
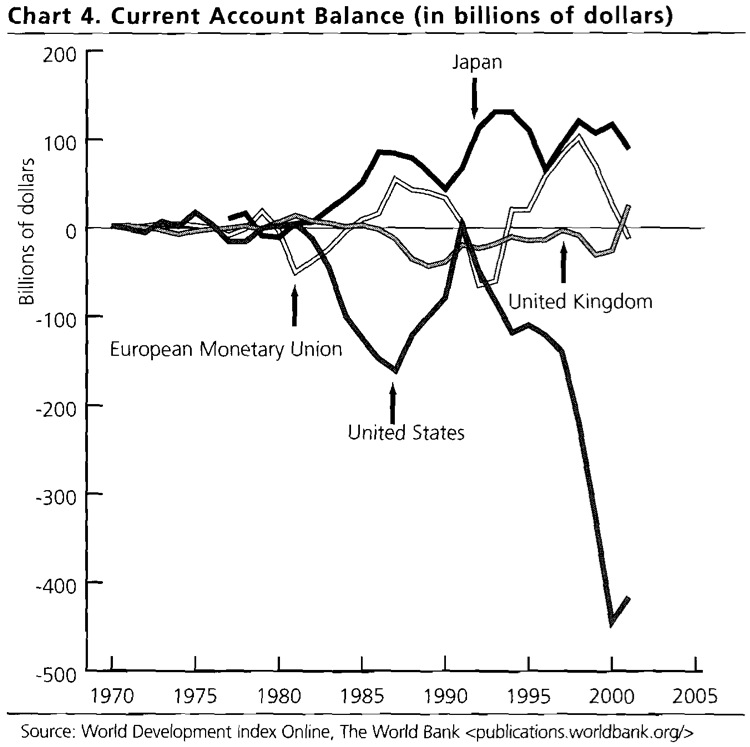
Other industrialized countries may also experience periods of deficit, but usually not for long periods, and after a while they generally swing between deficit and surplus. This can be seen in chart 4 that deals with the centers of imperialism. In the 1970s the current account balances hovered around the straight horizontal zero line. During the next decade, there were greater fluctuations, associated with a more intense struggle for world markets, involving increased concentration of capital and further penetration of the underdeveloped countries. However, a new stage of fluctuations emerged in the 1990s. The large current account deficit of the United States in this period was not only a sign of increasing imbalance in the global economy. It was also an indication of a new phase of uncertainty in the U.S. economy. With the U.S. economy approximately 25 percent of the global economy, the increasing fragility of the former signals the possibility for widespread economic dislocations in the future.
The Bush administration has only one answer (other than stepped-up military spending) to this entire economic quagmire: massive tax cuts for corporations and the wealthy. Basing its approach on a supply-side theory of investment that should be absolutely discredited by now, the administration believes that by increasing the economic surplus available to capital and redistributing income and wealth from the poor to the rich it will open the flood gates to investment and create the conditions for a new period of rapid growth. Yet, there is currently no shortage of investment-seeking surplus within the wealthy sectors of society. What are missing are the profitable investment opportunities for the absorption of this surplus. The chief problem has to do with an overaccumulation of money capital together with insufficient consumer demand. Existing trends with respect to consumption, in particular, do not portend well for those seeking to invest in new productive capacity. The massive tax cuts now proposed by the administration will only enrich the wealthy at the expense of the greater part of the population. Taking resources from the mass of the people, who would spend it for consumer goods, and giving them to the rich who would not, means a further undermining of consumption. At the same time, increasing the money capital in the hands of investors will not convince them to invest unless they consider it profitable to do so, which means that there has to be an expectation of a growth in future demand that will utilize existing capacity and justify its expansion. Right now this is simply a bad bet from a business standpoint. Despite twelve interest-rate cuts over the last two years, bringing the federal funds rate on overnight loans between banks down to 1.25 percent, its lowest level in forty-one years, the Federal Reserve Board has not been able to spur investment (New York Times, March 1, 2003).
The fact that there is little inkling in establishment circles of the underlying problems facing capitalist economies is hardly surprising. Economic experts and pundits debate endlessly about the federal government’s budgetary deficit, the current account deficit, the weakness of investment, and the bursting of the financial bubble, without ever considering the possibility that these might be mere symptoms of an underlying disease of stagnation. Since the prevailing wisdom is that a capitalist economy naturally tends toward high levels of investment, breakneck growth, and economic prosperity, the idea of a tendency toward stagnation, intrinsic to a mature capitalist economy, is excluded almost by definition. To the extent that it is recognized that the rate of growth of the U.S. economy has declined since the 1960s, this is seen as the result of an improper government policy mix rather than a reflection of a larger tendency endemic to the modern accumulation process.
In our view, a more realistic approach becomes possible once one adopts the hypothesis that stagnation is normal for advanced capitalism. From this perspective, it is the relatively unique periods of rapid growth such as the 1950s and 1960s that need to be explained rather than the slower periods of growth that dominated the second half of the twentieth century and the opening years of the twenty-first century.
The strong growth of the 1950s and 1960s can be accounted for by such historical factors as the buildup of consumer liquidity during the Second World War, the second great wave of automobilization of the U.S. economy (also encompassing the expansion of the steel, glass, and rubber industries and the building of the interstate highway system), the stimulus provided by two regional wars in Asia, and the massive increase of the sales effort associated with the modern marketing system. Most of these factors have vanished completely (as in the case of consumer liquidity) or have leveled off so that they no longer represent major growth factors for the economy. In the 1980s and 1990s the main stimulus was the growth of the financial superstructure of the economy. This was seen as connected, especially in recent years, to growth of the high-tech sector and the expansion of the Internet. These factors too have ebbed with the bursting of the stock market bubble and the decline in investment in high technology. Consequently, the economy right now lacks the kind of special historical factors necessary to generate rapid growth. Stepped-up military spending associated with the War on Terrorism has provided some economic stimulus but not yet on a scale in relation to overall GDP to compare with the wars of the 1950s and 1960s.
What the representatives of capital do seem to be good at under these circumstances is redistributing the effects of slow growth to make sure the costs of the slowdown fall primarily on workers and the poor (and on third world countries). Real wages are falling and at the same time drastic cuts are being made in government in programs that benefit the underlying population. Medicare benefits are being slashed and attempts are being made by the administration to privatize both Social Security and Medicare.
Like everything else in capitalism, this is ultimately a question of class struggle (intersecting with race and gender struggle). What is needed most under these conditions is a revolt from below to combat the prevailing politics and economics of inequality. The specter of such a revolt is perhaps the one thing that most worries those who are currently making themselves rich at society’s expense.
NOTES
* Bureau of Labor Statistics, “Mass Layoffs in November 2002,” December 24, 2002 www.bls.gov/mls/. Further data in this series will not be forthcoming since the Bush Administration cut off all funding for the Bureau of Labor Statistics’ Mass Layoff Statistics Program as of December 31, 2002.
* See Paul Baran and Paul Sweezy, Monopoly Capital (New York: Monthly Review Press, 1966), p. 261.
* Federal Reserve Board, “Household Debt-Service Burden,” Flow of Funds Accounts www.federalreserve.gov/releases/housedebt/default.htm.
* John Maynard Keynes, The General Theory of Employment, Interest and Money (New York: Harcourt, Brace and Company, 1936), p. 161.
Comments are closed.