The biennial State of Working America (hereinafter SWA), written by economists at the Economic Policy Institute in Washington, D.C., is the best compendium and analysis of U.S. labor market statistics there is.* In one convenient book, there are data on the distribution of income and wealth, all aspects of wages and benefits, employment and unemployment, poverty, regional labor markets, and international labor comparisons. In addition to the data, there are explanations for all of the major labor market trends. Does the stagnating minimum wage contribute to poverty? Is rising wage inequality the result of the growing educational requirements of jobs? Are trade agreements such as the North American Free Trade Agreement (NAFTA) necessarily good for workers as mainstream economists keep telling us? Why do the wages and incomes of racial and ethnic minorities continue to lag behind those of whites? Does the labor market model of the United States, with its very limited regulation, deliver better results for workers than does the more institutionally-constrained model of most European nations? Mishel, Bernstein, and Allegretto analyze their data using sophisticated statistical techniques to give us answers to these and many other questions. A review of this book, along with some critical commentary, will give readers a good idea of how workers in the United States have been faring and what they can reasonably expect in the future.
What do the data tell us about the state of the U.S. working class? Basically they tell us that, with one exception, workers in the United States have been taking a beating for the past thirty years. The single exception is roughly the period from 1995 to 2000. From 1995 to 2000, wages (unless otherwise indicated, wages will refer to “real” wages, a measure of the purchasing power of our wages) began to grow significantly after two decades of stagnation, especially for those workers at the bottom of the wage distribution. Poverty rates declined and unemployment rates fell to thirty-year lows. The gap between both black workers and Hispanics and whites declined, in terms of wages, family incomes, unemployment rates, and the incidence of poverty. However, this rebound in some of the most basic indicators of working-class well-being ended with the onset of recession in March 2001 and the beginning of what has accurately been described as a “jobless recovery” in November of that same year. During the recession and the recovery, unemployment rose and has stayed well above 5 percent up to the present. The gains made by minorities and those at the bottom of the income distribution have eroded. Most of the increases in total income have gone to the owners of capital; very little has found its way into the hands of workers. Most disturbingly, many months after the recovery began, employment remains stagnant and wages are once again falling behind the rise in prices.
Although the SWA contains labor market data covering the entire period after the Second World War, most of this volume concerns itself with the rapid economic expansion of the late 1990s, the downturn of 2001, and the recovery since then. So it makes sense for this review to do the same.
The authors stress that when unemployment is very low, workers benefit greatly and those at the bottom of the income distribution benefit the most. They also say that high productivity growth is essential, but this seems a dubious proposition, especially given the tremendous disconnect between productivity gains and wages over the past thirty years. And even more so since the very meaning of the word “productivity” is ambiguous to say the least. Productivity is very difficult to measure unambiguously, especially when applied to the economy as a whole, and even if we could measure it, it would be hard to know what it means. If a given number of workers produce more output but at the expense of their health or at the expense of our environment, is the productivity gain an obviously good thing? Even if we suppose that it is possible to say that, all else remaining equal, workers are now producing greater output than they did before, what is it about the increase in productivity that compels the payment of higher wages? A society whose output per person has risen obviously has more output to go around, but why would workers automatically get any of the greater output? The abstract fantasies of mainstream economists tell us that higher productivity automatically raises wages, but these are fantasies not the real world.
Table 1 shows the unemployment data. Although unemployment rates fell between 1992 and 2000, it wasn’t until the second half of the decade that they fell to levels not seen in decades. The national rate for 2000 was the lowest since 1969, and the 2000 rates for blacks and Hispanics were the lowest on record. (It must be noted that the black rate does not reflect the fact that more than one million black persons are in our jails and prisons. Many of these would be unemployed if they were not incarcerated. And many are in prison because employment was not available to them.) Such low rates meant that labor market shortages were the rule rather than the exception, and these shortages benefited workers. Employers had to raise wages to attract and keep employees. And because minority workers are always over-represented among those not working, they benefit the most from tight labor markets. However, note that with the onset of recession in 2001, minority unemployment began to rise again. Black unemployment rates have been double-digit since 2002.
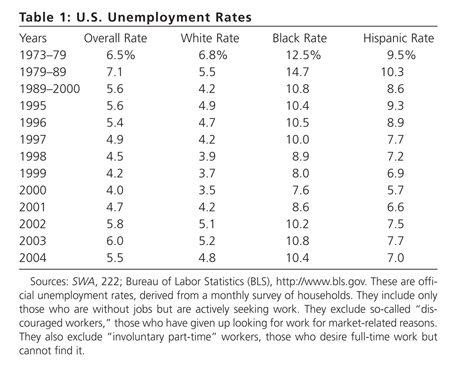
Table 1 does not include separate unemployment rates for women. These have been very close to, and in some years below, those for men for more than a decade. Women used to have higher unemployment rates than men, but the decline of sectors of the economy dominated by male employment, especially manufacturing, has helped to make the rates converge. Also not shown in the table is “hidden unemployment” (see note at the bottom of table 1), which fell dramatically during the expansion as part-time workers were able to find full-time jobs and those who had dropped out of the labor force reentered it and found work. However, this too has increased considerably during the recession and jobless recovery (see 242–48).
The correlation between low unemployment rates and wage rates is shown in table 2, which includes data from earlier years for comparison purposes. The workers included comprise what we normally think of as the working class, except for public employees. We see from these data how real wages rose dramatically between 1947 and 1973, then declined over the next twenty-two years before rising again between 1995 and 2003. The annual growth rate between 1995 and 2000 was the highest since the post-Second World War “golden age,” not coincidentally the period with the lowest unemployment rates since then too. After 1995–2000, wage growth slowed, as the economy entered recession and the jobless recovery. In 2004, the real wage declined, remarkable at a time when the economy is supposedly heating up.
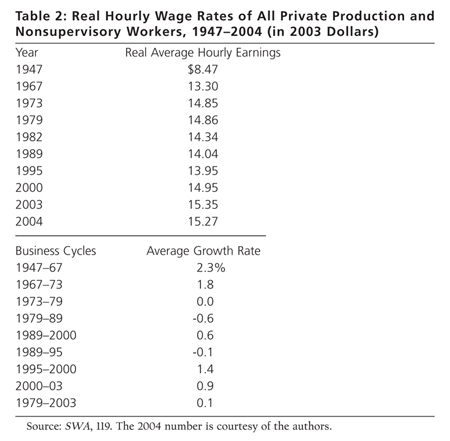
The wage numbers in table 2 are averages for workers as a whole, so as with the overall unemployment rates, they tell us nothing about specific categories of workers. Nor do they tell us anything about wage inequality. Several facts stand out if we take a broader look at wages:
1. Wage rates vary tremendously by race and by gender (166–67). In 2003, the median hourly wage rate of black men was about 73 percent that of white workers (in table 2, the wage rate is a mean, which is the simple average of all wage rates. The median wage rate is the wage rate right in the middle of all wage rates ranked from highest to lowest; 50 percent are higher and 50 percent are lower than the median.) The Hispanic median was about 64 percent of the white median wage rate. For women, the percentages for blacks and Hispanics were 86 and 75 percent respectively. The growth of these median wage rates for black and Hispanic men and for black women grew faster than the white median wage during the 1995–2000 expansion, again showing how low unemployment rates typically benefit most those at the bottom. Interestingly if we look at median family incomes instead of wage rates, we find that blacks and Hispanics gained even more on whites during this period. This is because low unemployment rates and the corresponding tight labor markets allowed more minority family members to find employment and encouraged employers to increase hours of work. However, the recession and jobless recovery have in large part reversed these gains (48).
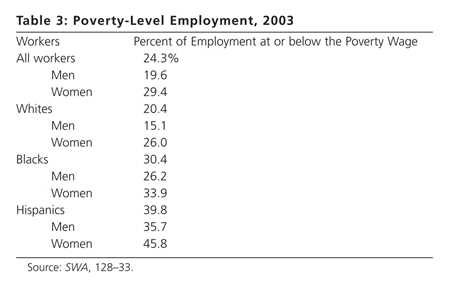
2.For a nation as rich as the United States, there are a very large number of low-paying jobs. One of the most interesting data sets in the SWA is that for the fraction of jobs which pay an hourly wage rate insufficient to support a family of four at the poverty level of income with full-time, year-round work. Below in table 3 are some of the data for 2003. During the expansion of the 1990s, women gained against men and blacks gained against whites in terms of laboring at poverty-level employment. Hispanics, on the other hand, fell further behind whites, no doubt because of increases in immigration of relatively unskilled Hispanic workers.
3.There is a great deal of wage inequality in the United States, and it has been growing since the late 1970s (120–27). The SWA authors look at high, middle, and low wage earners. High wages are those in the 90th percentile (only 10 percent of all workers earn more than these workers); middle earners are those at the 50th percentile (the median wage earner); and low wage earners are those in the 10th percentile (only 10 percent of workers earn less than these workers). The gap between the top and the middle has been rising throughout this period. However, the gap between the middle and bottom narrowed during the 1990s and has stayed constant since then. In this connection, it can also be noted that the gap between workers with high and low amounts of schooling has grown considerably since the 1970s. Two important aspects of wage inequality are the decline in the real value of the minimum wage and the runaway inflation of the salaries of top corporate officials. In terms of purchasing power, the federal minimum wage of $5.15 per hour is worth nearly 25 percent less today than it was in 1967 (200). Executive pay, on the other hand, has risen by leaps and bounds; if we limit ourselves just to salary and cash bonuses, CEO pay more than doubled between 1989 and 2003. The ratio of CEO pay to the wage of the average worker went from 24 in 1967 to 300 in 2000 (212–16). Certainly this increase must call into question the alleged connection between productivity increases and wages, unless we are to believe that the productivity of CEOs rose more than ten times faster than that of the average worker over this period.
During the 1995–2000 expansion, employment grew by amounts large enough to push the unemployment rate down to levels not seen in a long time, and these low rates helped workers to improve their economic circumstances (224–31). But once recession hit in March 2001, the economy began to shed jobs and continued to do so long into the recovery. While employment has rebounded in recent months, President George W. Bush’s first term has witnessed the poorest job performance since the presidency of Herbert Hoover. There are a few more jobs now at the end of his first term than there were at the beginning, but this is only due to an increase in public employment; private sector employment is lower. The data are quite remarkable. Between 2001 and the present, manufacturing shed jobs for forty-one consecutive months. Overall, 1.1 million jobs were lost during the first twenty-one months of the recovery! Employment growth has been weaker in this recovery than in any recovery since the Second World War. This is the second straight recovery (the last one was in 1991) in which many jobs were shed even as the economy was growing, but it is much worse in terms of both jobs lost and the time it has taken for employment to expand.
There is now tremendous slack in our labor markets even though the unemployment rate has fallen over the past three years and even though it didn’t reach levels typical of post-Second World War contractions. Evidence of labor slack can be seen in several statistics (237–55). First, the average duration of unemployment and long-term unemployment have been high even as the recovery has picked up steam. The average duration of unemployment in February of 2004 was 20.3 weeks, the highest since July 1983. However, the unemployment rate for the first date was 5.6 percent, while for the latter date it was 9.4 percent. Such a high average duration of unemployment with a relatively low unemployment rate is very unusual and a sure sign of labor market distress for workers. The long-term unemployed are those who have been searching for work for twenty-seven weeks or longer. In 2003, the long-term unemployed comprised 22.1 percent of all unemployed, again a very high number given the rate of unemployment. Even by the end of 2004, the long-term unemployed made up 20.2 percent of all unemployed, very much higher than in almost every recovery year for the past forty years. The long-term unemployed also include many workers with a college education, workers of prime working age, and workers in white collar and professional employment. Between 2000 and 2003, the highest growth in long-term unemployment occurred among those with a bachelor’s degree or higher, those forty-five and older, those in management and professional occupations, those in industries such as information and professional and business services, men, and whites. The last recession and the current recovery have seen labor market difficulties for a wide range of workers, again something quite unusual by historic standards.
A second sign of labor market slack is the decline in labor force participation rates, that is, the share of the working-age population actually in the labor force (the labor force consists of those employed and those unemployed). A decline in this means that people are dropping out of the labor force, an unhealthy sign during a recovery. At the end of 2004, the labor force participation rate was 66 percent, down one percentage point from what it was at the last business cycle peak in March 2001. Had the rate been the same in December of 2004 as it was in March of 2001, nearly 3,000,000 more persons would have been in the labor force. If we assume that these people dropped out of the labor force because they couldn’t find jobs and imagined them rejoining the labor force now, the unemployment rate would be nearly 7.5 percent.
If we shift our attention away from wages to income and the connected concept of wealth, two facts stand out. First, poverty, defined here as income below a certain threshold, is extensive in the United States (309–20, 324–28). The poverty threshold is very low, equal to three times a minimum food budget set by the Department of Agriculture. In 2003, it was $18,660, before taxes. The incidence of poverty overall in 2003 was 12.5 percent, which equates to just over 35,000,000 persons. Naturally, there is great variability in the incidence of poverty among groups. In 2003, the poverty rates for whites, blacks, and Hispanics were 10.5, 24.4, and 22.5 percent respectively. The overall rate for children under eighteen years of age was 19.8 percent; for whites, blacks, and Hispanics the rates were 14.3, 34.1, and 29.7 percent respectively. All of these rates shifted down dramatically during the 1995–2000 expansion, most of all for blacks and Hispanics. The overall rate was 11.3 percent in 2000, while that for blacks was 22.5 percent and that for Hispanics, 21.5 percent. These latter rates fell so much that the gap between minority and white rates closed to its lowest levels on record. Unfortunately, these positive trends have been reversed. Of course, in any discussion of poverty, we must realize that the official poverty thresholds are completely inadequate as measures of economic hardship. Many economists believe that thresholds twice the official one would better show how many people are in difficult economic circumstances. If we used such a threshold, the incidence of poverty would rise about two and one-half times; more than 88,000,000 would be classified as poor.
Second, both income and wealth are horribly unequally distributed (58–72, 277–307). The rich are definitely getting richer, both absolutely and relatively, and the poor are getting poorer in both senses as well. The economic pie has steadily gotten bigger, but the share going to those at the bottom has actually shrunk, as most of the gains from greater productivity have gone to the owners of capital. Families have been able to bring home higher incomes each year, but this has mainly been due to greater hours of work and more family members working. However, during the last recession, median family incomes fell for whites, blacks, and Hispanics and it may now be true that we are reaching limits to the ability of families to increase hours and send more members into the workplace. As with wage rates, the 1995–2000 expansion saw faster increases in family income for blacks and Hispanics than for whites. But since then, minorities have suffered much sharper losses than have whites. And today, as in the past, the ratios of black and Hispanic family income to white family income remain well below 65 percent.
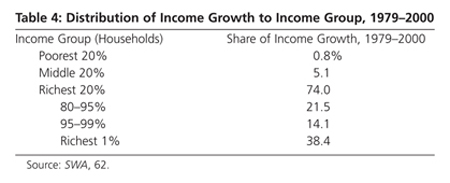
Incomes have been becoming more unequal for more than three decades, and even the rapid growth of the 1995–2000 period, which, as we have seen benefited working people in several ways, failed to reverse this trend. Table 4 and chart 1 provide some stark testimony to growing inequality. The table shows how the total increase in incomes between 1979 and 2000 was distributed among various income classes. The richest 1 percent of all households, whose income is mainly from capital (or capital income disguised as wages), grabbed an astonishing 38.4 percent of all of the income produced over a thirty-one-year period. The poorest 20 percent of households took home a mere 0.8 percent of the total income. Consider that in 2003 there were 111,278,000 households in the United States. One percent of this number is 1,112,780 households. These very rich households got a share of the income increase forty-eight times higher (38.4 divided by 0.8) than the 22,255,600 families which comprise the poorest 20 percent of households.
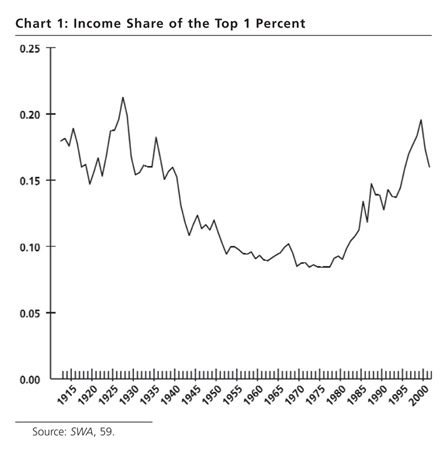
Chart 1
shows the share of total household income going to the richest 1 percent of households from 1913 to 2002. This chart graphically shows what has been happening in the United States. In the 1920s, capital reigned supreme, and workers were on the defensive, suffering a string of setbacks from which it was routinely predicted they would never recover. Yet they did recover and then some during the Great Depression, the Second World War, and the years immediately following the war. This upsurge corresponds roughly with the downward trend on the graph from the onset of the depression to the middle of the 1970s. The upward swing on the graph marks the attack on labor by capital which commenced at the end of the “golden age.” The graph slopes down when the stock market bubble collapsed in 2001, but it is again on the upswing as markets have recovered and capital continues to usurp the fruits of workers’ labor.
The distribution of wealth (the money value of all of an entity’s assets) is much more unequally distributed than income. The concept of net worth is useful here. This is the difference between total assets and total debt. Among the many statistical nuggets about wealth provided in SWA, here are some of particular interest:
- In 2001, the richest 1 percent of all households had 33.4 percent of all net worth. The bottom 90 percent had 28.5 percent. This is somewhat of an understatement for today since it reflects the losses suffered by the very rich in the recent stock market collapse, losses which have been largely reversed in the last two years.
- In 2001, 17.6 percent of all households had zero or negative net worth, and 30.3 percent had net worth less than $10,000.
- Wealth is racially divided. 13.1 percent of white households had zero or negative net worth in 2001, while this was true for 30.9 percent of black households. The median financial wealth (holdings of stocks, bonds, cash, and the like) of blacks was a paltry $1,100; for whites it was $42,100.
- The rich are asset heavy, especially with respect to financial assets (those which yield income), and debt poor, while the opposite is true for those with the lowest incomes. In 2001, the richest 1 percent of households owned 44.8 percent of all common stock (excluding stock owned through pensions); the poorest 80 percent owned 5.8 percent. This suggests that the poorest 10 or 20 percent own a minuscule share of stock. Even including stocks held through various pension arrangements, in 2001, those households with yearly incomes less than $15,000 held 1.1 percent of all stocks, while those with annual incomes equal to or greater than $250,000 owned 40.6 percent of all stock. Debt, on the other hand, bears down most heavily on the poor. In 2001, debt service payments made up 40 percent or more of yearly household income for 27 percent of those households with less than $20,000 in income. For households with yearly income between $90,000 and 100,000, the percentage was 2 percent. Of the former group, 13 percent were sixty days or more late paying their bills; for the latter group the rate was 1.3 percent.
It is important to note that there has been a tremendous inflation in asset prices over the past decade, first in stock prices and now in real estate. There is no question that the late 1990s saw a stock market bubble, and we are now witnessing a real estate bubble. However, asset price inflation greatly benefits the very rich. They own most of the assets whose prices rise, and they can use the rising prices to buy other assets solidifying their control over both the economy and the political system. Since this asset price inflation is part and parcel of modern monopoly capitalism and the political decisions that are its handmaiden (both bubbles were encouraged by Alan Greenspan and the Federal Reserve System), it can be seen as a subtle form of class struggle, one barely perceived by most of us.
What have been the causes of the trends so well illustrated in the SWA? The authors offer a number of explanations, supported by sophisticated statistical analyses. While mainstream economists like Harvard’s Martin Feldstein throw up their hands, mystified by the great rise in income and wage inequality, the SWA authors show us that the reasons for this are not hard to find at all. The tax system has become more regressive; tax rates have been lowered for the top income recipients and the largest corporations. This has channeled money from the poor to the rich, increasing inequality. The Bush tax cuts, for example, have transferred “0.8 percent of total, after-tax household income from the bottom 99 percent to the top 1 percent” (3).
Unions have become noticeably weaker; in 2004 union workers comprised only 12.5 percent of employed workers. Just twenty-one years before, density was 20.1 percent. In the private sector, union density in 2004 was 7.9, its lowest level since the early 1900s. Even in the public sector, density is down to 36.4 percent, from 37.2 percent in 2003. In Indiana and Missouri, new Republican governors have ordered an end to collective bargaining for state workers.
Union workers make much higher wages and more and better fringe benefits than do nonunion workers (189–98). In 2003, the union wage premium (the difference between union and nonunion wages after controlling for a variety of worker characteristics such as amount of schooling) was 15.5 percent (for black workers it was 20.9 percent and for Hispanics 23.2 percent). Therefore, as the labor force is increasingly made up of relatively more nonunion workers, average wages will fall. But in addition, unions benefit blacks and Hispanics more than whites, blue-collar more than white-collar workers, less-educated more than more-educated workers, and those at the bottom of the wage distribution more than those at the top. So as unions become less common, the wage gap between whites and minorities increases, as do those between blue- and white-collar workers, high school and college graduates, and low- and high-wage workers.
Another factor responsible for growing inequality is the decline in the purchasing power of the minimum wage noted above. This has happened because Congress has made the political decision not to increase the minimum wage over long periods of time. Then any rise in prices reduces the buying power of a fixed minimum wage. The major impact of this is on poor women, since women represent nearly 60 percent of all minimum wage workers as well as nearly 60 percent of all workers earning no more than one dollar an hour above the minimum wage (201). If the minimum wage were increased, both groups of workers would benefit as employers were forced to keep their wage structures in balance. The failure of the minimum wage to grow has greatly exacerbated inequality at the bottom of the wage distribution. Consider the wage gap between the poorest workers and those in the middle, that is between those workers earning a wage at the 10th percentile of the wage distribution and those at the 50th (median) percentile. SWA estimates that a falling real minimum wage is responsible for most of the growth in this gap, much more than can be accounted for by changes in the skill requirements of jobs or any failure of poor workers to increase their schooling. Overall, the authors estimate that the decline in union power and the fall in the real minimum wage are responsible for about one-third of the growth in wage inequality (5).
Mainstream economists have argued that one important source of inequality is a technologically-driven increase in the skill requirements of jobs. Workers who get large amounts of schooling will have these skills; those who don’t will not. Thus, technology will widen the gap between skilled and unskilled workers, or what amounts to the same thing, the gap between more and less educated workers. The authors of SWA demolish this argument (205–12). The details are too complicated for quick explanation. Suffice it to say that during the 1990s when technology presumably sped up and there was an accelerated introduction of computers into workplaces, nearly all types of wage inequality slowed down. Yet those at the very top of the wage distributions—mainly high-level corporate executives—are pulling away from everyone else, and it seems implausible that technology could be the cause of this. The wages of CEOs and their immediate subordinates have risen whether productivity increases (presumably driven by technology according to the mainstream) have been high or low, in corporations both low and high tech, in businesses doing well and in those not doing so well.
Any argument that we will be entering a period in which high skill will be necessary for most jobs does not stand up to the facts. As I said in these pages last April:
Nearly 30 million persons labor as teaching assistants, food preparers and servers, counter attendants, cashiers, counter and rental clerks, bookkeepers, customer service reps, stock clerks and order fillers, secretaries, general office clerks, assemblers, sorters, helpers, truck drivers, packers and packagers, and laborers. The Bureau of Labor Statistics estimates that the ten occupations with the largest job growth between 2000 and 2010 will be food preparation and service workers, customer service representatives, registered nurses, retail salespersons, computer support specialists, cashiers, general office clerks, security guards, computer software engineers, and waiters and waitresses. Of these, nurses and software engineers are the only obviously “good” jobs, and even these are rapidly being rationalized or outsourced by cost-conscious managers.
The SWA authors perform an interesting analysis in which they take the occupational structure of 2002 and compare it with BLS projections for 2012 (216–18). Assuming that the BLS estimates are correct, they show that there will be very minimal occupational “upgrading,” and this will require only slightly greater educational attainment and wage rate. For example, the BLS data show that in 2002, 26.9 percent of jobs required a college education, but this will rise to just 27.9 percent by 2012. Hardly anything to write home about. It may be that skill requirements of any given job might rise (as opposed to rising skill requirements due to a change in the occupational structure), but history doesn’t lend much evidence for this possibility.
The emphasis by mainstream economists on technology as a causal factor in the conditions of workers is matched by their fixation on “free” trade as something which is of obvious benefit to working people (178–89). I put the word free in quotes because much trade among nations is anything but free, such as trade in the services of doctors and lawyers and materials and methods that are patented or copyrighted. But if we look at the impact of the North American Free Trade Agreement and others like it, we see clearly that “free” trade has been a disaster for workers. The political decisions which ended capital controls and pushed through these trade agreements have led to large increases in imports of manufactured consumer goods and capital goods used in manufacturing; they have promoted the shifting of U.S.-based production overseas to low-wage venues in Mexico and China; they have given employers a gigantic club with which to threaten workers and obtain wage concessions from them; and they have given rise to the phenomenon of outsourcing both unskilled and skilled jobs. The consequences have been very large losses of manufacturing employment, lower wages for workers with less skill and schooling, and high unemployment for highly skilled workers such as computer programmers. The authors estimate that trade-related impacts on workers have been responsible for another one-third of the growth in wage inequality. They don’t have estimates of the amount of outsourcing of jobs. However, in a recent study done for the U.S.-China Economic and Security Review Commission, researchers Kate Bronfenbrenner and Stephanie Luce found that in the first quarter of 2004 alone as many as 100,000 jobs (suggesting about 400,000 per year) were outsourced. Their absolute rock-bottom estimate was 25,000, and this was more than five times higher than the estimate of the Bureau of Labor Statistics.
To say that the jobs of U.S. workers are being outsourced to lower wage countries is not to say that U.S. workers should be privileged over those in other countries. Workers everywhere are subject to the same forces. NAFTA has provided few benefits and lots of harm to Mexican workers, and the cheap U.S. corn flooding Mexican markets is wreaking havoc on Mexican peasants, forcing them to abandon the land and seek employment in the cities of Mexico and the United States. Jobs are now being outsourced from Mexico to China, and should wages rise enough in China, jobs will be outsourced from there too.
Mishel, Bernstein, and Allegretto offer by way of conclusion the observation that the economy today is at a crossroads. It can take a path leading back toward the kind of “virtuous cycle” which existed in the long post-Second World War boom and in the shorter expansion at the end of the 1990s. Or it can continue on the path set in motion after the long boom and the shorter expansion ended. Let us look at each of these paths.
The SWA authors correctly point out how beneficial low unemployment rates are for working people. As we have already noted, they refer to the 1995–2000 period throughout the book, pointing out the gains made by workers. They even compare it favorably to the long post-Second World War (1947–73) boom in which workers saw both their real wages double and fringe benefits expand in scope and increase in amounts, and in which all income groups from the bottom to the top shared in roughly equal degree the tremendous rise in productivity. They are hopeful that the economy can return to the growth trajectory exhibited in the 1995–2000 period.
I am more pessimistic about this. The authors might have delved into the mini-boom of the late 1990s a little more deeply as have other economists such as Robert Pollin and David Kotz. In referring to the 1995–2000 period, the SWA authors tell us what they mean by a “virtuous cycle” (19–34). As the economy begins to expand, certain conditions must exist for the expansion to continue, to become self-reinforcing. The key is for the income generated by the expansion to be broadly shared. As they put it, “…broad-based income gains generate equally broad consumption, triggering greater confidence among investors and producers. This confidence in turn feeds greater investment and sustains further growth. At the same time, these growing incomes boost government coffers, leading to a better fiscal position and other associated benefits, from reassuring financial markets to providing government with more resources to meet social needs” (21). The “virtuous cycle” is helped along by “strong labor market institutions” such as labor unions and rising minimum wages.
The most virtuous of “virtuous cycles” was the long economic boom from the end of the Second World War until the middle of the 1970s. The pent-up domestic demand from the war (buttressed by large savings, the growth of credit purchases, and public subsidization of housing and schooling—limited, however, to whites) and enormous demand for U.S. capital exports by war-ravaged Europe tightened labor markets and made business expectations about the future very positive. This caused an increase in capital spending, which in turn tightened labor markets further. Wages rose both because of strong demand for labor and because relatively strong labor unions forced businesses to share some of the increases in revenues. All of this made workers more confident about the future and more willing to spend money. The automobile industry boomed, and this greatly increased capital spending in a host of areas from steel, oil, and glass to road, home, restaurant, and motel construction. Meanwhile the rudiments of a social safety net were in place, including social security and unemployment compensation. Government spending continued upward as military spending never fell back to what it was before the war, and enormous highway building and other government-financed construction projects grew in size. Hence a virtuous cycle of investment and employment growth, wage and consumer spending growth, higher tax revenues and government spending, optimistic expectations about the future all around, all of these leading to the whole process beginning anew. Capital controls and limited international competition kept most of the gains inside the country.
Of course, the postwar boom came to an end as all booms must, for reasons expounded by the editors of this magazine for many years. And I do not mean to imply that the “golden age” was in all ways good for workers. But even so, it is difficult to see how the 1995–2000 expansion can be compared to that of the “golden age.” It is true that there were significant increases in capital spending and then in consumer spending. But it is also true that much of the investment spending as the expansion proceeded was due to the overly optimistic expectations generated by the stock market bubble. As even those who should have known better began to suggest that the expansion might go on indefinitely, businesses got caught up in a spending frenzy lest they fall behind their competitors. What this investment spending did mainly was create a lot of excess capacity throughout the economy, and excess capacity cannot rise without sooner or later bringing an end to an investment boom. Consumption spending was fueled by both the inflation in stock prices—through the “wealth effect” by which households spend more because they have more wealth, that is, a greater sense of economic security—and borrowing (itself pumped up by the greater paper wealth which could be used as collateral for loans). When the stock bubble burst in 2000, it wasn’t long before investment and consumer spending stopped rising. What is more, the higher income brought about by the expansion were not at all equitably shared, so there could not be the kind of broad-based working-class spending that marked the “golden age.”
The federal government received an enormous tax revenue windfall as the rise in stock prices brought in billions of dollars in capital gains taxes. But the government did not use its revenues to increase the amounts of money spent on the social welfare programs that would make workers healthier, better educated, and more productive, things which would reap many future benefits. As Pollin points out, spending on education, for example, failed to keep up with the growth of the economy as a whole. Instead draconian crime bills were enacted and poor women were denied welfare.
Two final points can be made here. First, there were not the institution forces at work which were there during the golden age. The labor movement continued to shed members and lose both economic and political power throughout nearly the entire expansion. This denied workers the larger share of the economic growth they would have had had they been able to count on strong unions. The declining political power of unions meant that they could not effectively pressure the government to raise the minimum wage and do all of the other things that both increase the security of workers and their disposable incomes. Luckily there was an earned income tax credit which does help poor working people to help maintain and improve slightly their standard of living. Second, today a lot of any increase in incomes leaks out of the domestic economy in the form of spending on imports. The thorough deregulation of the economy continued throughout the 1990s, especially through the passage of NAFTA. This set the stage for massive movements of capital overseas and the outsourcing of both unskilled and skilled jobs.
What all of this amounts to is that it is hard to argue that there was anything close to a “virtuous cycle” during the boom of the late 1990s. A good indication of this is the speed with which things deteriorated for workers once the boom ended. And as we have seen, the current expansion, now three years old, has seen little in the way of recovery for workers. Real wages are falling, and employment is just now getting back to where it was when Bush took office. As the authors of SWA make crystal clear, most of the gains of the current recovery have gone to capital not labor:
[In the corporate sector of the economy] inflation-adjusted capital income grew 32.2% over the recession and jobless recovery, while real compensation [wages plus benefits] was up only 1.2%. Thus, the vast majority (84.6%) of the real income growth in the corporate sector since the first quarter of 2001 has accrued to capital income, a hugely disproportionate share when considering that capital income comprised just 16.6% of total corporate income when the recession started in early 2001. (31)
So where does all of this leave us. Whither the workers of the United States? We have seen that with the exception of a brief period at the end of the 1990s and the beginning of the new century, it is clear that workers have become increasingly insecure in their employment and in their lives when they become unemployed. And it is also clear that the late 1990s expansion was not fueled by a “virtuous cycle,” but by a stock market bubble and a large volume of consumer debt. Once the bubble ended, the downward trend in worker well-being continued where it had left off before the expansion began. With the country bogged down in war in Iraq, Bush tax cuts guaranteeing enormous budget deficits and higher interest rates into the indefinite future, no obvious demand stimulus on the horizon, a mountain of debt limiting long-term growth of consumption, a record trade imbalance which has made the country thoroughly dependent on the willingness of foreigners to buy government bonds, and the continued outsourcing of jobs, it is difficult to see anything but a bleak future for workers. What is more, structural changes in the way the labor markets function appear to be creating a greater disconnect between the growth of the nation’s output and the expansion of employment.
The state of working America is in large part a function of the class struggle. Although wages, hours, employment, unemployment, and productivity might appear to be determined by what happens in the impersonal marketplace and by the independent impact of technological changes, in reality all of these are shaped by the struggle between workers and employers as this occurs in both workplaces and in the larger political arena. If the statistics which define the economic conditions of working people show deterioration, then this is evidence that employers have increased their power. If this is happening at the same time that the economic conditions of capitalists are improving, then it is certain that this is so. We can probe the data further to see if we can tell why workers are losing power, and this in turn can help us to develop strategies and tactics to help workers regain what they have lost and to push ahead. What this long review of The State of Working America makes clear is that the rebuilding of power of the U.S. working class is really the only thing which can give workers any sense of hope that the future will be in any way better than the past thirty years. And this rebuilding must be on an entirely different basis than in the past. It must have a radical vision, which understands that this system has had more than enough time to fulfill its promises and admits that it cannot do so. And U.S. labor must, above all, ally itself with workers in the rest of the world, especially in the poor countries. For example, in addressing the outsourcing of jobs and immigrant labor, labor must never scapegoat workers in other countries. Instead of demanding protection from outsourcing, it must demand expanded unemployment compensation, full pay while retraining, and a public commitment to full employment. Instead of feeding anti-immigrant hysteria, it must support immigrant rights, show solidarity with workers’ movements in the countries from which immigrants come, and take the lead in demanding a complete revamping of U.S. foreign policy.
Note on Sources
The page numbers in parentheses are for page references in The State of Working America, 2004–2005. Unless otherwise noted, all other data have been taken from the Bureau of Labor Statistics (www.bls.gov) or the Bureau of Census (www.census.gov). The references to works by Pollin and Kotz are Robert Pollin, Contours of Descent: U.S. Economic Fractures and the Landscape of Global Austerity (New York: Verso, 2003), and David Kotz, “Neoliberalism and the U.S. Economic Expansion of the ’90s,” Monthly Review, April 2003. The study by Bronfenbrenner and Luce is Kate Bronfenbrenner and Stephanie Luce, The Changing Nature of Corporate Global Restructuring: The Impact of Production Shifts in the U.S., China, and around the Globe, report submitted to the U.S.-China Economic and Security Review Commission, October 14, 2004. The article from which I quoted myself is “Workers Looking for Jobs, Unions Looking for Members,” Monthly Review, April 2004. On Martin Feldstein’s inability to analyze income inequality, see Michael Yates, “The Rich, the Poor, and the Economists,” available at https://monthlyreview.org/nftae02.htm.
* Lawrence Mishel, Jared Bernstein, and Sylvia Allegretto, The State of Working America: 2004-2005 (Ithaca, N.Y: Cornell University Press, 2005), 484 pages, paper $24.95. Visit the EPI website, www.epinet.org, to learn more about their work.
Comments are closed.