Top Menu

Dear Reader, we make this and other articles available for free online to serve those unable to afford or access the print edition of Monthly Review. If you read the magazine online and can afford a print subscription, we hope you will consider purchasing one. Please visit the MR store for subscription options. Thank you very much. —Eds.

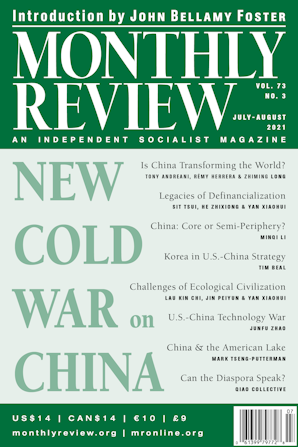
The Political Economy of the U.S.-China Technology War

5G technology booth

A booth showcasing 5G technology is pictured at an industry expo in Beijing. Photo by Chen Xiaogen. Credit: Zhou Jin, “US hit over declaration on 5G with Slovenia,” China Daily, August 15, 2020.

Junfu Zhao is a PhD candidate in economics at the University of Utah. Zhao can be reached at junfu.zhao [at] utah.edu. The author thanks Rudiger von Arnim, Minqi Li, and Han Cheng for their helpful comments.

Following the Donald Trump administration’s publication of its 2017 National Security Strategy and 2018 National Defense Strategy that designated China as a strategic competitor, the tensions between the United States and China have been heightened, encompassing trade disputes, China’s economic regime and territorial sovereignty, conflicts over geopolitical influences, and even the portrayed confrontation between liberal democracy and authoritarianism.1 The inauguration of the Joe Biden administration has not significantly changed U.S. foreign policy toward China. In his Interim National Security Strategic Guidance, Biden repeatedly referred to the “growing rivalry with China” and proposed an ambitious agenda seeking to “prevail in strategic competition with China or any other nation.”2

The current turn of U.S.-China relations toward strategic competition signals the deep strains of the contemporary international order. For one thing, the United States and China are the two largest economies in the world. The U.S. gross domestic product (GDP) measured at current prices and exchange rates made up 24.4 percent of the world GDP in 2019, down from 30.5 percent in 2000, while China’s economy was 16.3 percent in 2019, up from 3.6 percent in 2000. GDP measured at purchasing power parity even shows the reversal of the two economies’ weights. The U.S. share of world GDP measured at purchasing power parity decreased from 20.9 percent in 2000 to 15.8 percent in 2019, while China’s share increased from 6.4 percent to 17.3 percent in 2019.3 Therefore, the fear of falling (that is, losing U.S. global primacy) is an integral part of the U.S. dominant group’s psychology, underlying the drive to tame China.4 Given the sheer size of the two economies and the central roles they are playing in global production networks, the dynamics of U.S.-China relations have far-reaching ramifications for the contemporary capitalist world-economy.

Here I focus on one of the key components of U.S.-China strategic competition: the technology war, in which the integrated circuit industry is the central battleground. The essence and implications of the technology war can be further understood in the broader context of the international division of labor and the two countries’ internal contradictions. From this front, we can decipher the antagonism between different classes/groups within and across the two countries. The capitalist world-economy under declining U.S. hegemony is facing a fundamental dilemma that will not be settled any time soon.

Technology War in the Integrated Circuit Industry

No one disputes the strategic importance of advanced technology, which is the backbone of maintaining and improving national income, strengthening military capabilities, and safeguarding national security in the capitalist interstate system. The logic of intercapitalist and interstate competition compels these actors to struggle to get ahead of or not fall behind others. The U.S.-China technology war revolving around semiconductors (which I will use interchangeably with integrated circuits [ICs] and chips) is such a race, though not symmetric. ICs are a key input for next-generation technologies, such as 5G, artificial intelligence, Internet of things, and Industry 4.0 system. The United States has taken proactive measures to slow China’s progress in the IC industry, even before the trade war started in 2018.

Currently, the United States holds a clear leadership in the IC industry, while China is still seeking to bridge this large gap. The trade statistics are revealing in this respect. In 2010, the U.S. trade surplus in the IC industry was $14.7 billion, gradually decreasing to $3.1 billion in 2016 and $2.1 billion in 2018, but then climbing again to $11.5 billion in 2020. Of the U.S. IC trade surplus, China accounted for 27.5 percent in 2010, 96.0 percent in 2016, and 72.5 percent in 2020.5 China has been running a persistent trade deficit in the IC industry. In 2020, China’s import of ICs reached $350.9 billion and its export was only $117.1 billion.6 Although firms located in China might stockpile semiconductors in face of the recent supply chain uncertainty and, though China’s import might include products designed by Chinese firms but manufactured abroad, the trade statistics still reflect China’s overdependence on overseas supplies of semiconductors. According to a report by IC Insights, China has been the largest market for ICs since 2005, but the IC production in China represented only 15.9 percent of its $143.4 billion market in 2020. Moreover, China-headquartered companies produced only 36.5 percent ($8.3 billion) of the ICs manufactured in China in 2020.7

The production of ICs is highly complex and globalized. The process of producing ICs can be divided into three stages: (1) design, (2) manufacturing, and (3) assembly, testing, and packaging. The design stage is knowledge intensive, requiring teams of skilled engineers, and is often aided by intellectual property companies that provide specific intellectual property cores for advanced integrated circuits and by electronic design automation companies that provide specialized design tools. The manufacturing stage is capital intensive, requiring heavy capital investment and advanced technological expertise. In contrast, the stage of assembly, testing, and packaging is labor intensive and requires less technical skills. For the last two stages, equipment suppliers and raw material suppliers also play a critical role. There are two operating models for IC production: integrated device manufacturer and fabless foundry. An integrated device manufacturer firm carries out all stages of IC production, while in the fabless-foundry model, the IC production is split among fabless design firms, foundry firms, and outsourced semiconductor assembly and test firms.8 The United States dominates the semiconductor global value chain, especially in the integrated device manufacturer, fabless design, and equipment markets, with market shares of 51 percent, 65 percent, and 40 percent respectively, resulting in an overall semiconductor global market share of 47 percent in 2019.9 China—except Taiwan, which is preeminent in the foundry segment—has gained market shares in fabless design, foundry, and outsourced semiconductor assembly and test (10 percent, 7 percent, and 12 percent respectively in 2015).10 However, China’s segment of the semiconductor global value chain focuses on lower value-added functions and less sophisticated chips, and the country is extremely weak in equipment and electronic design automation software.11

Given the asymmetry in the semiconductor technology race, we can understand China’s efforts to catch up and the desire of the United States to slow or even stall China’s progress. Since the 1990s, the Chinese government has adopted various industrial policies (including the 908 and 909 projects in the 1990s, and the State Council’s Circular No. 18 in 2000 and Circular No. 4 in 2011) to facilitate the development of its IC industry.12 The measures included tax breaks, government procurement, protection of intellectual property, and attracting foreign capital, technology, talents, and so on. Recognizing the large deficiencies of its IC industry, in 2014 the Chinese State Council issued Outline of the Program for National Integrated Circuit Industry Development—in which the key measure is to establish the National IC Industry Investment Fund (¥120 billion)—in order to reduce the gap and ultimately leapfrog to the advanced world level in all major segments of the IC industry by 2030. In face of U.S. sanctions on certain Chinese technology entities in the trade war, the Phase Two National IC Industry Investment Fund (¥200 billion) was established in 2019, and the State Council further issued Circular No. 8 in 2020 to accelerate the IC technology catch-up.

On the U.S. side, the measures restricting technology diffusion have long been in place. In concert with the Wassenaar Arrangement established in 1996, the United States has implemented export controls to prevent the proliferation of advanced semiconductors and the inputs necessary to produce them, covering semiconductor manufacturing equipment, materials, software, intellectual property, and finished semiconductors. In addition to the Commerce Control List applied to China as a whole, the United States has also applied stricter end-use and end-user controls that prohibit certain Chinese end uses and end users from access to U.S.-origin commodities, software, or related technical data.13 At the turn of the century, the practice of U.S. export agencies was aimed at keeping China at least two generations (about three to four years) behind global state-of-the-art semiconductor manufacturing production capabilities.14 Moreover, Chinese firms’ attempts to acquire advanced semiconductor technology by acquisition of foreign firms have been prohibited or highly restricted in the United States and other countries.15 Since Trump took office in 2017, the race in the semiconductor industry has escalated into a technology war, in which the United States has stepped up prohibitive measures to suffocate China’s advance in the high-tech realm. The Section 301 investigation accused China of unfair economic practices including forced technology transfer and cybertheft of intellectual property, serving as an excuse for the U.S. initiation of the trade war (therefore, the trade war closely relates to the technology war).16 Later, some Chinese semiconductor-related technology companies such as Huawei, Fujian Jinhua, and Sugon were placed on the Entity List (administered by the U.S. Bureau of Industry and Security), denied access to U.S.-origin key inputs.17

On the surface, it seems that the U.S. sanctions were meant to undermine Chinese technology entities, impose trade loss to, and extract concessions from China. But as U.S.-China strategic competition has unfolded, it appears that it has just begun and tensions are not fading with Trump’s departure from the White House. For the United States, the technology war is as much a matter of domestic affairs as an attempt at restraining China. Some faction of the U.S. ruling elite wants to divert attention away from U.S. internal failures by accusing China of misbehaving. And some faction wants to leverage the fear about China’s ambitious industrial upgrading plan to forge the ruling circle’s unity and push for massive domestic investment in infrastructure, education, and research after decades of neoliberal practices. In other words, they declare that another “Sputnik moment” has come and the state must lead again in the technology competition.18 In particular, the U.S. Semiconductor Industry Association is consistently calling for a $50 billion federal government program of additional grants and tax incentives for building semiconductor manufacturing capacities for the next decade.19

It must be recognized that there is no full consensus on how to deal with China, given that U.S. capitalists have substantial material interest in access to China’s gigantic market and cheap and quality labor. In March 2020, the Boston Consulting Group produced a report entitled How Restrictions to Trade with China Could End US Leadership in Semiconductors. This report proclaimed that the U.S. semiconductor market leadership is reinforced by a virtuous innovation cycle: higher research and development investment leads to higher revenues and profits, and higher revenues and profits sustain higher research and development investment. They worried that the U.S. export controls would compel the U.S. semiconductor firms to concede global market shares to foreign players and thus turn the virtuous cycle into a vicious one.20 Another realistic concern is that U.S. export controls might help align the incentives of Chinese capitalists—who relied on foreign markets and foreign high-tech inputs, and specialized in the low-value-added and low-tech niches—with the Chinese leadership’s call for domestic self-reliant innovation, and thus might backfire.21

The last concern is certainly true. Although the alleged “forced” technology transfer seems to be a major cause of the U.S. trade sanction, China’s practice of “trading market for technology” for the last four decades has not brought about key and core technologies, and sometimes even choked off the growth of domestic technological innovation capabilities.22 In defending its position in the trade war, China pointed out that following the life cycle of a product, transnational companies usually transfer already obsolete or standardized technologies to developing countries.23 Aware of the problem, Xi Jinping emphasized that key and core technologies cannot be acquired through requesting, buying, or begging, to garner support for the self-reliant innovation strategy.24 Facing the U.S. export controls, Chinese capitalists used to sourcing key components from the global market have to become more inward-looking and self-reliant.

Though the self-reliant innovation strategy is gaining consensus, there are still obstacles to China’s advancement in the IC industry. Accompanied with the underdevelopment of China’s semiconductors is the lack of expertise. In the rush to build semiconductor manufacturing capacities, opportunistic behaviors of investors and local governments are common, due to the inability to assess or monitor the quality of projects. One notable example is Wuhan Hongxin Semiconductor Manufacturing Co. formed in November 2017, which branded itself as a project that would adopt the most advanced IC fabrication technology with $20 billion investments. It obtained billions of yuan from the local government, but recently turned out to be a fraud by a few private investors who had no knowledge about semiconductor manufacturing, and now it is closed without having produced a single chip.25 Moreover, lacking an effective national-level coordination mechanism, local investments in semiconductors tend to be repetitive, low-quality, and wasteful.26 Overcoming these obstacles is critical in developing a competitive and largely self-sufficient IC industry.

International Division of Labor

In comparing the U.S. and Chinese economies and discussing the U.S.-China rivalry, scholars usually perceive these two countries as following autonomous and distinctive paths on equal footing. For example, Branko Milanovic, a prominent researcher on global inequality and author of Capitalism, Alone, dubbed the United States as a model of liberal meritocratic capitalism, and China as a model of state-led political capitalism, with both having pros and cons and competing for global influences.27 This perspective with countries as a unit of analysis often tends to overlook countries’ differentiated roles in the international division of labor and fails to see capitalism as a unified world-system that has system-level constraints and dynamics. The U.S.-China technology war can be better understood in the broader context of the capitalist world-system (or world-economy).

The capitalist world-economy has a persistent core/periphery hierarchy: core states manage to enclose within their jurisdictions mainly quasi-monopolistic and high value-added production processes (“core-like” activities); peripheral states engage in highly competitive and low value-added production processes (“periphery-like” activities); semi-peripheral states keep a more or less even mix of core-like and periphery-like activities. As Immanuel Wallerstein put it, “there is a constant flow of surplus-value from the producers of peripheral products to the producers of core-like products. This has been called unequal exchange.”28 Core-like activities are everchanging—as more states and capitalists strive to enter highly profitable niches, the increasing competitive pressure will dissipate the original quasi-monopolistic rent derived from core-like activities, and these erstwhile core-like activities will become more and more peripheral.29 Therefore, to maintain their privileged positions, core states have to occupy new quasi-monopolistic areas and at the same time try to exclude others from encroaching on core-like activities. This is the economic essence of contemporary technology competition.

To measure the hierarchical international division of labor, the exchange of labor time embodied in international trade is pertinent. Using the extended Leontief input-output method, I have calculated the employment footprint of each country’s final demand (which mainly consists of final consumption and gross capital formation).30 The basic idea is simple: the goods and services that each country consumes and invests are produced with labor inputs at each node of global production networks. With the world input-output table and the satellite direct labor input data, we can find how much labor time from what country is embodied in a country’s final demand. In this way, a network of country-to-country labor time flows can be retrieved from international trade, reflecting the core/periphery hierarchy of the capitalist world-economy.31 The data are collected in the Eora global supply chain database Eora26, covering 190 countries and 26 sectors from 1990 to 2015.32 Labor time is measured by full-time employment (person-year). Moreover, at a node of global production networks where labor is expended, a market value (so-called value added) is also generated. However, the value added per unit of labor can vary widely across different nodes, depending on whether it is a core-like activity or periphery-like activity. Therefore, I have also calculated the average nominal value added per unit of labor time for a country’s imported labor and exported labor separately, which offers another angle for assessing a country’s position in the international division of labor.

The results for the United States and China are summarized in Table 1. Throughout the entire period from 1990 to 2015, the United States stayed at the higher end of the international division of labor, while China consistently struggled at the lower end despite its unprecedented economic growth. In 2015, the United States exported 9.7 million person-years (the U.S. labor time embodied in foreign final demand) and imported 72.7 million person-years (the foreign labor time embodied in the U.S. final demand), with the latter being 7.5 times as large as the former. For U.S. exported labor, the average value added reached approximately $130,000 per person-year in 2015, while for U.S. imported labor, the average value added was only $30,600 per person-year. In other words, 1 U.S. person-year was equivalent to 4.2 (130/30.6) foreign person-years on the world market in 2015.

Table 1. International Labor Exchange, 1990–2015

A. The U.S. Labor Exchange with the Rest of World

1990 1995 2000 2005 2010 2015
Labor Time (million person-years)
Import 45.8 59.1 102.2 117.6 80.0 72.7
Export 10.5 12.1 8.7 8.1 9.6 9.7
Import/Export 4.4 4.9 11.8 14.6 8.4 7.5
Value Added / Labor Time (thousand dollars per person-year)
Import 9.3 10.9 11.1 14.2 25.1 30.6
Export 38.5 53.6 79.4 106.5 122.3 130.0
Export/Import 4.1 4.9 7.1 7.5 4.9 4.2

B. China’s Labor Exchange with the Rest of World

1990 1995 2000 2005 2010 2015
Labor Time (million person-years)
Import 2.7 6.5 9.6 17.8 25.2 28.6
Export 110.4 144.8 155.1 182.8 133.5 114.1
Import/Export 0.02 0.04 0.06 0.10 0.19 0.25
Value Added / Labor Time (thousand dollars per person-year)
Import 11.2 16.6 18.7 22.9 36.3 42.1
Export 0.70 1.2 1.8 3.4 8.8 14.4
Export/Import 0.06 0.07 0.10 0.15 0.24 0.34

Notes: Labor time is measured as the size of full-time employment devoted to producing goods and services. Value added is nominal, measured in USD at current prices and exchange rates. All numbers are calculated by the author using the Eora26 data (v199.82) from the Eora global supply chain database.

In stark contrast, China was a major labor time exporter. In 2015, China exported 114.1 million person-years and imported 28.6 million person-years, with the labor import-export ratio being a quarter. The average value added for China’s exported labor was approximately $14,400 per person-year, while for China’s imported labor, it was $42,100 per person-year. Therefore, 1 Chinese person-year was equivalent to 0.34 (14.4/42.1) foreign person-years on the world market in 2015. In addition, for the U.S.-China bilateral trade, the United States could exchange 1 person-year for approximately 9 (130/14.4) of China’s person-years. Of the U.S. 72.7 million person-years of labor import in 2015, about one-third (24.6 million person-years) came from China.

From the perspective of the international labor exchange, it is quite obvious that the capitalist world-economy is highly unequal. China still holds a disadvantaged position in the international division of labor, engaging in largely periphery-like activities and supplying massive labor time to the Global North. The United States clearly benefits from its quasi-monopolies of core-like activities. Two examples—the global IC industry and the well-known Apple value chain—suffice to illustrate this point. For the semiconductor value chain, half of the industry’s total value added occurs at the design stage, where the United States dominates. The stage of assembly, packaging, and testing—where China has managed to gain presence—only captures 6 percent of the total value added.33 For the successful product iPhone 4, Apple’s design and marketing activities captured 58.5 percent of its sales price ($549 in 2010) while the labor in China, where the product was assembled, costed only 1.8 percent of the sales price.34 Using Intan Suwandi’s theoretical framework of labor value chains, surplus value is extracted from the Global South (where labor is expended) and captured by multinational monopoly capital headquartered in the Global North.35 A country’s capability to capture value on global production networks is reified in its GDP per capita.36 In 2019, China’s GDP per capita measured at current prices and exchange rates was less than one-sixth that of the United States; when measured at purchasing power parity, the number was barely one-fourth.37 Hence, it makes no sense to speak of a U.S.-China hegemonic contest.

Table 1 also shows the relative changes in the positions of the United States and China in the international division of labor from 1990 to 2015. China has been successfully climbing the ladder. China’s ratio of import to export of labor time gradually increased from 0.02 in 1990 to 0.25 in 2015, and its ratio of value added per person-year for exported labor to that for imported labor increased from 0.06 in 1990 to 0.34 in 2015.

The United States has experienced an inverted-V path. The U.S. ratio of import to export of labor time ballooned from 4.4 in 1990 to 14.6 in 2005, and afterward the ratio decreased to 7.5 in 2015. The U.S. ratio of value added per person-year for exported labor to that for imported labor improved from 4.1 in 1990 to 7.5 in 2005, and then deteriorated to 4.2 in 2015. The period from 1990 to 2005 can be seen as one during which the United States successfully reflated its hegemonic power after the severe crisis in the 1970s by cutting off many unprofitable manufacturing segments, pushing for globalization of production, and expanding financial activities.38 As Giovanni Arrighi and Beverly Silver contend, financial expansions are a recurrent phenomenon—which can temporarily inflate the power of the declining hegemonic state—when the hegemonic power faces intensifying interstate and interenterprise competition and escalating social conflicts.39 Nevertheless, the effects of the U.S. financial expansion (as well as globalization of production) did not last long. The U.S. capability of extracting labor from the rest of world and its position in the international division of labor decisively declined after 2005.

Here we can draw a clue about the reasons why the United States has become more aggressive toward China. If China were to indulge itself with the role of cheap labor platform, U.S. hegemony would enjoy a longer period of glory.

The Imperative for China’s Economy to Upgrade

In his book The Rise of China and the Demise of the Capitalist World Economy, Minqi Li discussed three major tasks for the Chinese Communist Party after it came to power in 1949: (1) reverse China’s long-term economic and geopolitical decline in the capitalist world-system; (2) provide necessary material and social conditions to meet the basic needs of Chinese people; (3) fundamentally transform political, economic, and social relations in China as well as in the world-system toward socialism. Revolutionary China greatly succeeded at the second task, moderately succeeded at the first, and failed at the third.40 Constrained by brutal interstate geopolitical and military competition and the desire of the state-party elite to consolidate their material privileges, China underwent a drastic reorientation toward a single objective: economic growth. Economic inequality has been tolerated as long as economic growth can deliver visible material gains. As Arrighi argues, national wealth as measured by per capita income is the primary source of national power in a capitalist world. Assessed through this lens, China’s economic reforms since 1978 have been a resounding success on the empowerment of the country.41

After rapid growth for nearly four decades, China’s economy has witnessed a sharp decline in profitability in recent years. According to Li’s estimates, China’s economy-wide profit rate dropped from more than 20 percent in 2010 to 12.4 percent in 2018, and economic crisis is likely to burst out when the profit rate stays below 10 percent for several years.42 This provides a further angle from which we can understand the technology war.

Profitability is critically determined by the profit share of output and the capital-output ratio. The change in the capital-output ratio is driven by the incremental capital-output ratio that can be measured as the ratio of gross fixed capital formation to the increase in GDP. Chart 1 presents China’s incremental capital-output ratio and Chart 2 presents China’s profit share and labor share.

Chart 1. China’s Incremental Capital-Output Ratio, 1991–2019

Zhao Chart 1. China's Incremental Capital-Output Ratio, 1991–2019

Notes: The data on gross fixed capital formation and GDP are from China’s National Bureau of Statistics. They have been transformed into real terms using the 1990 constant prices.

As shown in Chart 1, during the last decade or so, China’s incremental capital-output ratio rose dramatically from 4.9 in 2008 to 9.2 in 2019, reflecting the increasing “inefficiency” of new investments—the output associated with one unit of investment became less and less. In other words, traditional fruitful outlets for capital were shrinking, leading to intensifying intercapitalist competition.

The change in the balance of class forces also added to the difficulty of profitability. As shown in Chart 2, the profit share of income (or output) that goes to capital decreased from 26.6 percent in 2010 to 24.2 percent in 2017—a 2.4 percent reduction. This was driven by the change in the share of income that goes to labor, which rose from 46 percent in 2010 to 50 percent in 2017—a 4 percent increase, reflecting the working class’s strengthening bargaining power. The campaign against the 996 working hour system (employees work from 9:00 am to 9:00 pm, six days a week), which is prevalent in China’s technology firms, is illustrative. Traditionally, the employees of technology firms were an upper segment of the working class and enjoyed high wages and promotion opportunities, and thus were willing to tolerate long working hours. But as the growth prospect of technology firms deteriorated and competition intensified in recent years, the jobs and promotion opportunities of the employees became much more insecure, which gave rise to widespread disgust and resistance against long working hours, reified in the “996.ICU” movement.43

Chart 2. China’s Profit Share and Labor Share of Income, 1992–2017

Zhao Chart 2. China's Profit Share and Labor Share of Income, 1992–2017

Notes: The data are from China’s National Bureau of Statistics. The provincial data on labor compensation, operating surplus (profits), and total income (GDP) are aggregated to the national level.

Hence, it is imperative for China’s economy to upgrade and grow. It is attempting to engage in more core-like activities and capture a larger share of value on global production networks so as to provide profitable outlets for capital and accommodate the rising demand of working people. This is the underlying logic of China’s efforts to speed up industrial upgrading and technology advancement.44 But it inevitably clashes with U.S. interests in maintaining technological leadership.

The Dilemma within the Contemporary Capitalist World-Economy

At first glance, it is puzzling that the United States imposed aggressive trade sanctions on China (as well as on its own allies, though to a lesser extent), given the fact that the United States extracts surplus value from the rest of world through the existing international division of labor. At least two factors account for this anomaly.

First, real wages of U.S. workers have stagnated and U.S. internal inequality has risen significantly since the late 1970s.45 This has fueled the antiglobalization sentiments and the support for Trump. As Daron Acemoglu pointed out in Foreign Affairs, “Trump’s popularity surged based on positions diametrically opposed to Republican orthodoxy: restricting trade, increasing spending on infrastructure, helping and interfering with manufacturing firms, and weakening the country’s international role.”46 These demands run counter to the capitalists who are making substantial profits from globalized production.

Second, U.S. capitalists intend to protect their incumbent positions and avoid competition in core-like activities. The United States has alleged that “Beijing’s economic policies have led to massive industrial overcapacity that distorts global prices and allows China to expand global market share at the expense of competitors operating without the unfair advantages that Beijing provides to its firms.”47 China’s industrial upgrading will likely generate competitive pressures and reduce the profit margins that U.S. capitalists have enjoyed so far. Blocking Huawei—the Chinese company that took the lead in global 5G technology—reflects the U.S. capitalists’ deep sense of insecurity.48

Nonetheless, the globalized U.S. capitalists are unwilling to forego China’s market and cheap labor. In 2017, the sales of U.S.-invested firms that operate in China reached $700 billion, making a profit exceeding $50 billion.49 China’s participation in labor-intensive and low value-added segments of global value chains also enables U.S. firms to specialize in lucrative design and marketing activities.50 Hence, the best scenario for the U.S. capitalists is that China would give up industrial upgrading and stick to the current international division of labor.51

To be sure, China’s ruling elites also have substantial interests in preserving the existing international order. China’s long-term export-oriented growth has led to entrenched interests of coastal provincial governments, export manufacturers, and their lobbyists.52 Besides, China’s overdependence on foreign oil and its internal sovereignty issues make China eager to sustain the stability of the current interstate system.53 Given these considerations, it is quite unlikely that U.S.-China strategic competition will result in a full-scale confrontation for the foreseeable future.54

However, the underlying forces of the capitalist world-economy never stop functioning, bringing about a fundamental dilemma unique to the current hegemonic cycle. Historically, populations living in core states have never exceeded 20 percent of the total population of the capitalist world-system. The enlargement of core populations was made possible by the peripheralization of territories that used to be outside of the world-economy.55 Under U.S. hegemony, the world-economy has encompassed the whole globe and there are no more untouched territories and populations that could be further exploited to support substantial expansion of the core. China, a country with a 1.4 billion population (about 18 percent of the world population), is moving up into and through the semi-periphery zone by striving to enclose within its jurisdiction more core-like activities, which will inevitably generate immense competitive pressures on the existing core states and capitalists. If China succeeds in industrial upgrading, the profits of core capitalists, incomes of core states, and privileges of their peoples are likely to be squeezed. The already declining U.S. hegemony will have far less resources with which to manage internal and external affairs that are increasingly complex. If China fails in industrial upgrading, the profitability crisis will burst and economic stagnation will ensue. The historical legacy of China’s national liberation, socialist revolution, and third worldism will help turn China’s working class into an anticapitalist and anti-imperialist revolutionary force that will shake the capitalist world-system. There is no easy solution to this fundamental dilemma unless the paradigm of economic growth is abandoned, a solution that is incompatible with capitalism.

Conclusion

The writing is on the wall for the capitalist world-economy. The recent disorder of international relations, global pandemic, ensuing economic recession, and U.S. internal conflicts along class and racial lines are signals that the world-economy has entered a phase of chaos, precipitated by the incapability of declining U.S. hegemony to deal with increasingly complex issues. The U.S.-China technology war also reveals a fundamental dilemma. On one hand, China’s march in the technology realm threatens the superiority of core states and capitalists in the international division of labor and will further weaken U.S. hegemony; on the other hand, it is imperative for China’s economy to upgrade and grow in order to accommodate the demands of both capital and labor. Time will tell how this will unfold in our unstable world.

Notes

  1. National Security Strategy of the United States of America (Washington DC: Trump White House Archives, 2017); Jim Mattis, Summary of the 2018 National Defense Strategy of the United States of America (Washington DC: U.S. Department of Defense, 2018).
  2. Joseph Biden, Interim National Security Strategic Guidance (Washington DC: White House, 2021).
  3. The data on GDP measured at current prices and exchange rates, as well as measured at purchasing power parity (2017 international dollar) are from the World Bank’s World Development Indicators database.
  4. For an excellent discussion on the psychology of declining hegemonies, see Robert Denemark, “Pre-Emptive Decline,” Journal of World-Systems Research 27, no.1 (2021): 149–76.
  5. The data on the export and import of integrated circuits are from the UN Comtrade Database, and the category for integrated circuits is Standard International Trade Classification (SITC) Revision 4 commodity code 7764 “Electronic integrated circuits.”
  6. The data are from China’s Customs Statistics, accessed May 20, 2021. The category for integrated circuits is “8542 Electronic integrated circuits.”
  7. China Forecast to Fall Far Short of its ‘Made in China 2025’ Goals for ICs,” IC Insights, January 6, 2021.
  8. Beyond Borders: The Global Semiconductor Value Chain,” Semiconductor Industry Association and Nathan Associates, May 2016.
  9. 2020 State of the U.S. Semiconductor Industry,” Semiconductor Industry Association, June 2020.
  10. Marcelo Duhalde and Yujing Liu, “‘Made in China 2025’: How Beijing Is Boosting Its Semiconductor Industry,” South China Morning Post, September 25, 2018.
  11. Seamus Grimes and Debin Du, “China’s Emerging Role in the Global Semiconductor Value Chain,” Telecommunications Policy (2020): 101959.
  12. Douglas Fuller, “Growth, Upgrading and Limited Catch-up in China’s Semiconductor Industry,” in Policy, Regulation, and Innovation in China’s Electricity and Telecom Industries, ed. Loren Brandt and Thomas G. Rawski (Cambridge: Cambridge University Press, 2019), 262–303.
  13. Saif M. Khan, S. Semiconductor Exports to China: Current Policies and Trends (Washington DC: Center for Security and Emerging Technology, 2020).
  14. Export Controls: Rapid Advances in China’s Semiconductor Industry Underscore Need for Fundamental U.S. Policy Review (Washington DC: U.S. General Accounting Office, 2002).
  15. Executive Office of the President and President’s Council of Advisors on Science and Technology, Ensuring Long-Term U.S. Leadership in Semiconductors (Washington DC: Obama White House Archives, 2017).
  16. Findings of the Investigation into China’s Acts, Policies, and Practices Related to Technology Transfer, Intellectual Property, and Innovation under Section 301 of the Trade Act of 1974,” Office of the United States Trade Representative and Executive Office of the President, March 22, 2018.
  17. Khan, S. Semiconductor Exports to China.
  18. Seth Center and Emma Bates, “Tech-Politik: Historical Perspectives on Innovation, Technology, and Strategic Competition” (brief, Center for Strategic and International Studies, December 2019).
  19. Antonio Varas, Raj Varadarajan, Jimmy Goodrich, and Falan Yinug, Government Incentives and US Competitiveness in Semiconductor Manufacturing (Boston: Boston Consulting Group and Semiconductor Industry Association, 2020).
  20. Antonio Varas and Raj Varadarajan, How Restrictions to Trade with China Could End US Leadership in Semiconductors (Boston: Boston Consulting Group, 2020).
  21. Lorand Laskai, “Why Blacklisting Huawei Could Backfire: The History of Chinese Indigenous Innovation,” Foreign Affairs, June 19, 2019.
  22. For theoretical discussions and detailed case studies of China’s technological development in the nuclear power, LCD panel, CNC machine, and high-speed railway industries, see Feng Lu, Toward Self-Reliant Innovations 2: New Sparks [in Chinese] (Beijing: China Renmin University Press, 2020).
  23. The Facts and China’s Position on China-US Trade Friction (Beijing: Information Office of the State Council, 2018), 30.
  24. Xi Jinping, “Strive to Become the World’s Major Science Center and Innovation Highland” [in Chinese], Qiushi, June 2021.
  25. Hui Tse Gan, “Semiconductor Fraud in China Highlights Lack of Accountability,” Nikkei Asia, February 12, 2021.
  26. “Voice from the Ministry of Industry and Information: 5G and Chips Cannot Be Developed by Blindly Following the Trend” [in Chinese], China Semiconductor Industry Association, March 10, 2021.
  27. Branko Milanovic, Capitalism, Alone: The Future of the System That Rules the World (Cambridge, MA: Belknap Press of Harvard University Press, 2019).
  28. Immanuel Wallerstein, World-Systems Analysis: An Introduction (Durham: Duke University Press, 2004), 28.
  29. Giovanni Arrighi and Jessica Drangel, “The Stratification of the World-Economy: An Exploration of the Semiperipheral Zone,” Review (Fernand Braudel Center) 10, no.1 (1986): 9–74.
  30. For a detailed description of the method, see Ali Alsamawi, Joy Murray, and Manfred Lenzen, “The Employment Footprints of Nations: Uncovering Master-Servant Relationships,” Journal of Industrial Ecology 18, no.1 (2014): 59–70.
  31. Junfu Zhao, “Investigating the Asymmetric Core/Periphery Structure of International Labor Time Flows: A New Network Approach to Studying the World-System,” Journal of World-Systems Research 27, no.1 (2021): 231–64.
  32. For descriptions and discussions, see Manfred Lenzen et al., “Mapping the Structure of the World Economy,” Environmental Science & Technology 46, no. 15 (2012): 8374–81.
  33. Antonio Varas et al., “Strengthening the Global Semiconductor Supply Chain in an Uncertain Era,” Boston Consulting Group and Semiconductor Industry Association, April 2021.
  34. Kenneth L. Kraemer, Greg Linden, and Jason Dedrick, “Capturing Value in Global Networks: Apple’s iPad and iPhone,” Alfred P. Sloan Foundation and U.S. National Science Foundation, July 2011.
  35. Intan Suwandi, “Labor-Value Commodity Chains: The Hidden Abode of Global Production,” Monthly Review 71, no. 3 (July–August 2019).
  36. John Smith, “The GDP Illusion: Value Added versus Value Capture,” Monthly Review 64, no. 3 (July–August 2012): 86–102.
  37. “World Development Indicators,” World Bank, accessed May 20, 2021.
  38. Financialization of nonfinancial U.S. firms is enabled by their leading roles in global value chains. See Tristan Auvray and Joel Rabinovich, “The Financialisation-Offshoring Nexus and the Capital Accumulation of US Non-Financial Firms,” Cambridge Journal of Economics 43, no. 5 (2019): 1183–218.
  39. Giovanni Arrighi and Beverly J. Silver, Chaos and Governance in the Modern World System (Minneapolis: University of Minnesota Press, 1999), 32–33.
  40. Minqi Li, The Rise of China and the Demise of the Capitalist World Economy (New York: Monthly Review Press, 2008), 25–26.
  41. Giovanni Arrighi, Adam Smith in Beijing: Lineages of the Twenty-First Century (London: Verso, 2008), 371–73.
  42. For detailed discussions about China’s economic profit rate, see Minqi Li, Profit, Accumulation, and Crisis in Capitalism (New York: Routledge, 2020), 71–89.
  43. Li Xiaotian, “The 996.ICU Movement in China: Changing Employment Relations and Labour Agency in the Tech Industry,” Made in China Journal 2 (2019).
  44. The ambitious industrial upgrading plan Made in China 2025, issued by China’s State Council, sketched out similar challenges. “Made in China 2025” [in Chinese], China State Council, May 8, 2015.
  45. Lawrence Mishel, Elise Gould, and Josh Bivens, “Wage Stagnation in Nine Charts,” Economic Policy Institute 6 (2015): 2–13.
  46. Daron Acemoglu, “Trump Won’t Be the Last American Populist,” Foreign Affairs, November 6, 2020.
  47. United States Strategic Approach to the People’s Republic of China (Washington DC: White House, 2020).
  48. Yun Wen, The Huawei Model: The Rise of China’s Technology Giant (Urbana: University of Illinois Press, 2020), 90–114.
  49. Research Report on U.S. Gains from China-U.S. Trade and Economic Cooperation [in Chinese] (Beijing: Ministry of Commerce, 2019). See also China’s Position on the China-U.S. Economic and Trade Consultations [in Chinese] (Beijing: State Council Information Office, 2019).
  50. Bo Meng, Ming Ye, and Shang-Jin Wei, “Measuring Smile Curves in Global Value Chains,” Oxford Bulletin of Economics and Statistics 82, no.5 (2020): 988–1016.
  51. This dream has been implicitly expressed in The Longer Telegram by an anonymous U.S. former senior government official. It blames all the troubles of U.S.-China relations on the personality of Xi Jinping, who became China’s leader in 2012. Anonymous, The Longer Telegram: Toward a New American China Strategy (Washington DC: Atlantic Council, 2021).
  52. Ho-Fung Hung, “Hegemonic Crisis, Comparative World-Systems, and the Future of Pax Americana,” Journal of World-Systems Research 23, no. 2 (2017): 637–48.
  53. Sahan Savas Karatasli and Sefika Kumral, “Territorial Contradictions of the Rise of China: Geopolitics, Nationalism and Hegemony in Comparative-Historical Perspective,” Journal of World-Systems Research 23, no. 1 (2017): 5–35.
  54. Thomas J. Christensen, “There Will Not Be a New Cold War: The Limits of U.S.-China Competition,” Foreign Affairs, March 24, 2021; Martin Wolf, “Containing China Is Not a Feasible Option,” Financial Times, February 2, 2021; Minghao Zhao, “Is a New Cold War Inevitable? Chinese Perspectives on US–China Strategic Competition,” Chinese Journal of International Politics 12, no. 3 (2019): 371–94.
  55. Sahan Savas Karatasli, “The Capitalist World-Economy in the Longue Duree: Changing Modes of the Global Distribution of Wealth, 1500–2008,” Sociology of Development 3, no. 2 (2017): 163–96.
2021, Volume 73, Issue 3 (July-August 2021)
Comments are closed.

Monthly Review | Tel: 212-691-2555
134 W 29th St Rm 706, New York, NY 10001