Top Menu

Dear Reader, we make this and other articles available for free online to serve those unable to afford or access the print edition of Monthly Review. If you read the magazine online and can afford a print subscription, we hope you will consider purchasing one. Please visit the MR store for subscription options. Thank you very much. —Eds.

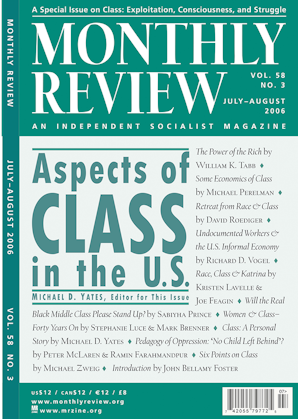
Some Economics of Class

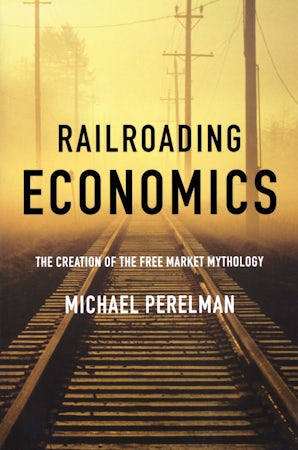
Michael Perelman (michael [at] rocko.csuchico.edu) teaches economics at California State University at Chico and is the author of fifteen books, including Manufacturing Discontent: The Trap of Individualism in Corporate Society (Pluto Press, 2005) and Railroading Economics: The Creation of the Free Market Mythology (Monthly Review Press, 2006).

How much more will be required before the U.S. public awakes from its political slumber? Tepid action in the workplace, the voting booth, and the streets have allowed the right wing to steamroll revolutionary changes that have remade the entire sociopolitical structure of the United States. Since the election of Franklin Roosevelt in 1932, every Democratic administration with the exception of Lyndon Johnson’s has been more conservative—often far more conservative—than the previous Democratic administration. Similarly, every elected Republican administration, with the single exception of George Herbert Walker Bush’s, has been more conservative than the previous Republican administration. The deterioration in the distribution of income is a symptom of a far larger problem. Perhaps formulating the situation in the United States might help people understand their class interests as well as reveal who has benefited from the right-wing revolution.

Critics of Marx have long taken pleasure in claiming that the rise of the middle class in the United States and other advanced capitalist economies disproves Marx’s “predictions” of the course of capitalism. In recent decades, however, the distribution of income in the United States is coming to resemble that of many poor Latin American economies, with a shrinking middle class and an obscene share of wealth going to the richest members of society.

While proponents of the U.S. model pretend that recent economic trends represent a success, in truth, they are signs of capitalism’s failure. Once capitalism began to falter in the late 1960s, the ruling class in the United States was unable to gain ground by ordinary business practices. So, the ruling class pursued a two-fold strategy: attacking workers rights while pursuing tax cuts, deregulation, and government subsidies. In effect, when forces integral to the normal functioning of capitalism began to depress the rate of profit, the ruling class adopted measures to change the balance of power in a way that would shift wealth and income in its direction.

Between 1970 and 2003, the Gross Domestic Product (GDP) adjusted for inflation almost tripled, from $3.7 trillion to $10.8 trillion.1 Because the population also increased by about 35 percent during that same period, per capita income more than doubled. However, not everyone’s income rose. Hourly wage earners certainly did not benefit from the economic growth. According to government statistics, hourly wages corrected for inflation peaked in 1972 at $8.99 measured in 1982 dollars. By 2003, hourly wages had fallen to $8.29, although they rose modestly using a different measure of inflation.2

Economists Thomas Piketty from the French research institute, CEPREMAP, and Emmanuel Saez of the University of California at Berkeley assembled detailed information about the distribution of income using data from the Internal Revenue Service. They defined income in current 2000 dollars as annual gross income reported on tax returns, excluding capital gains and all government transfers (such as Social Security, unemployment benefits, welfare payments, etc.) and before individual income taxes and employees’ payroll taxes. For the bottom 90 percent of the population, the average income stood at $27,041 in 1970, then peaked in 1973—at the same time as hourly wages—at $28,540. This figure bottomed out in 1993 at $23,892. By 2002, average income for this group stood at $25,862, about 4.5 percent below where it stood in 1970.3

This estimate does not mean that everybody in the bottom 90 percent fell behind but that the losses among the vast majority of these people were sufficient to counterbalance the gains of the more fortunate members of the bottom 90 percent. So probably 80 percent of the population was worse off in 2002 than in 1970.

At the top, matters were quite different. Piketty and Saez found that in 1970 the top ten corporate CEOs earned about forty-nine times as much as the average wage earner. By 2000, the ratio had reached the astronomical level of 2,173 to 1. The rate of growth of executive pay has also outstripped the rate of growth of profits. For example, between the periods 1993–1995 and 2001–2003, the ratio of total compensation to the top-five executives of public companies to those companies’ total earnings increased from 4.8 percent to 10.3 percent.4

Despite the decline in the average well-being of people in the bottom 90 percent of the population, because the population grew by approximately 30 percent, this group probably still received about 30 percent of the increase in the GDP. In addition, the GDP does not exactly equal the income figures of the Internal Revenue Service, but the figures are close enough to conclude that the top 10 percent of the population received the lion’s share of all economic growth between 1970 and 2000.

You can quibble with the Piketty and Saez estimates about the distribution of income. Including transfers, such as Social Security, and by using a different estimate of inflation, the incomes of the bottom 90 percent of the population appear to have grown by about 20 percent between 1970 and 2002—approximately a mere 0.6 percent per year. However, looking at the situation from another perspective, this data may be far too conservative in estimating how much the poor have fallen behind and the rich have prospered. First of all, the data exclude capital gains, which represent a major share of the income going to the very rich. In addition, as Richard Titmuss observed in 1962, efforts by the rich to avoid taxes makes the distribution of income appear far more equal than it actually is.5

Academic economics has done little to investigate the extent of this distortion, although David Cay Johnston’s outstanding book, Perfectly Legal, which describes the contribution of the tax system to inequality, forcefully demonstrates how the law permits the rich to use ingenious means to hide their wealth and income in order to avoid paying taxes.6 Many of the tax avoidance schemes are perfectly legal, even though they may violate the spirit of the law; others, what economist Max Sawicky calls do-it-yourself tax cuts, are not.7

For example, in a globalized economy, hiding money offshore is not particularly difficult. One recent study estimated that the world’s richest individuals have placed about $11.5 trillion worth of assets in offshore tax havens, mainly to avoid taxes. This amount is roughly equal to the GDP of the United States. Of course, citizens of the United States are not responsible for the entire $11.5 trillion, but then the report does not take account of the assets that corporations stash in tax havens.8 Although the Internal Revenue Service (IRS) occasionally convicts an unsophisticated offender, this practice is relatively safe.

In addition, taxpayers underestimate their tax liabilities by inflating the cost basis of assets on which they take capital gains. One estimate puts the extent of this inflation at about one-quarter trillion dollars.9 This practice obviously serves to benefit the richest taxpayers, although it does not affect the Saez and Piketty results, which exclude capital gains.

Of the estimated 16 percent of the legal tax obligation that goes unpaid, according to the latest data from the IRS, we can rest assured that the vast majority comes from the wealthiest members of society. The clever tactics of tax avoidance prevent the IRS data from capturing a good deal of the wealth and income of the top 10 percent of the population. In short, as hotel magnate Leona Helmsley famously said, “Only the little people pay taxes.” The government facilitates shenanigans, such as those used by Helmsley, by steadily increasing the complexity of the tax code while reducing the resources for enforcement. Helmsley served eighteen months in jail for her financial transgressions, but not because of diligence on the part of the government. She refused to pay money due to contractors. The resulting civil suit incidentally exposed her tax fraud.

The IRS also reinforces inequities between rich and poor by devoting a disproportionate share of its scrutiny to those without substantial resources, especially poor people who declare an Earned Income Tax Credit.10

Over and above tax-related distortions of the distribution of income, the wealthy have access to resources that do not count as income. Consider Johnston’s description of the personal use of corporate jets:

When William Agee was running the engineering firm Morrison-Knudsen into bankruptcy, he replaced its one corporate jet, already paid off, with two new ones and boasted about how the way he financed them polished up the company’s financial reports. His wife, Mary Cunnigham Agee, used the extra jet as her personal air taxi to hop around the United States and Europe. When Ross Johnson ran the cigarette-and-food company RJR Nabisco, which had a fleet of at least a dozen corporate jets, he once had his dog flown home, listed on the manifest as “G. Shepherd.” And Kenneth Lay let his daughter take one of Enron’s jets to fly across the Atlantic with her bed, which was too large to go as baggage on a commercial flight.11

Here again, Johnston understates the situation. Consider this fuller description of the RJR-Nabisco case:

After the arrival of two new Gulfstreams, Johnson ordered a pair of top-of-the-line G4s, at a cool $21 million apiece. For the hangar, Johnson gave aviation head Linda Galvin an unlimited budget and implicit instructions to exceed it. When it was finished, RJR Nabisco had the Taj Mahal of corporate hangars, dwarfing that of Coca-Cola’s next door. The cost hadn’t gone into the hangar itself, but into an adjacent three-story building of tinted glass, surrounded by $250,000 in landscaping, complete with a Japanese garden. Inside a visitor walked into a stunning three-story atrium. The floors were Italian marble, the walls and floors lined in inlaid mahogany. More than $600,000 in new furniture was spread throughout, topped off by $100,000 in objets d’art, including an antique Chinese ceremonial robe spread in a glass case and a magnificent Chinese platter and urn. In one corner of the ornate bathroom stood a stuffed chair, as if one might grow fatigued walking from one end to the other. Among the building’s other features: a walk-in wine cooler; a “visiting pilots’ room,” with television and stereo; and a “flight-planning room,” packed with state-of-the-art computers to track executives’ whereabouts and their future transportation wishes. All this was necessary to keep track of RJR’s thirty-six corporate pilots and ten planes, widely known as the RJR Air Force.12

David Yermack of New York University’s Stern School of Business produced a paper with the delightful title “Flights of Fancy: Corporate Jets, CEO Perquisites, and Inferior Shareholder Returns,” in which he investigated the relationship between this particular luxury and corporate efficiency. He found that the cost for CEOs who belong to golf clubs far from their company’s headquarters is two-thirds higher, on average, than for CEOs who have disclosed air travel but are not long-distance golf-club members.13

Based on Yermack’s paper, a Wall Street Journal article entitled “JetGreen” described corporate jets “as airborne limousines to fly CEOs and other executives to golf dates or to vacation homes where they have golf-club memberships.”14 To add insult to injury, the government subsidizes corporate jets. For example, the government waves the hefty landing fees that commercial aircraft must pay in order to support the air traffic control system. The value of these subsidies amounts to billions of dollars.15 A significant amount of these subsidies benefits the private lives of corporate executives.

High-level corporate executives enjoy many other perquisites besides free travel, including the provision of luxury boxes at sports stadia, chefs, lawn care, and a multitude of other benefits that ordinary people would have to pay for on their own, if only they could afford them. New York Times business columnist, Gretchen Morgenson, described the excesses of Donald J. Tyson, former chairman of Tyson Foods, ranging from the personal use of corporate jets to housekeeping and lawn care. Echoing Leona Helmsley, she appropriately titled her article “Only the Little People Pay for Lawn Care.”16

The Piketty and Saez data also overestimate the welfare of the poor, especially if one considers the fact that ordinary people must increasingly work more hours to get what they earn. For example, between 1970 and 2002, annual hours worked per capita rose 20 percent in the United States, while falling in most other advanced economies.17 Besides, for ordinary workers, benefits, such as pensions and health care, are in rapid decline. Finally, the reported income of the poorer segments of society does not take account of many expenses that poor people pay. For example, the data ignores the late fees that banks and other corporations charge, along with usurious interest rates, and various other costs that fall mostly on the least fortunate. Even though the government disregards these factors in assembling its statistics about wealth and income, they can be significant. For example, in 2004, banks, thrifts, and credit unions collected a record $37.8 billion in service charges on accounts, more than double what they got in 1994, according to the Federal Deposit Insurance Corporation and the National Credit Union Administration. Banks are also raising fees for late payments, low balances, and over-the-limit charges to as much as $39 per violation. Some banks even charge for speaking with a service representative. These fees predominately fall on the poor.18

Even among the richest 10 percent of the population, the unseemly distribution of income is increasingly skewing toward the richest of the rich. In 1970, the top 0.01 percent of taxpayers had less than 0.53 percent of total income. By the year 2000, their share had soared to 3.06 percent. In other words, the income of these 13,400 taxpayers exploded from being fifty-three times the national average to an almost unbelievable 306 times, slightly less than it was in the peak year of 1928, right before the Great Depression. These 13,400 richest families in the United States had about the same income as the poorest 25 percent of the households in the country.19 Of course, membership in this elite group was not unchanging, but it was probably relatively stable. Certainly, few of these fortunate people ever fell into the bottom 25 percent.

Ownership of wealth is even more concentrated than income. With the bursting of the dot-com bubble, wealth inequality had temporarily fallen a bit, as it usually does during an economic decline. Even so, by 2001, the top 1 percent of households owned 40 percent of the financial wealth in the United States.20 Had the calculation of the wealth holdings of the richest 1 percent been made while the stock market had still been expanding, the number would have been even more extreme than the reported 40 percent. I have no doubt that inequality will continue its upward climb in the absence of a new recession or a rapid change in the political climate.

At the same time, ordinary people are rapidly losing their pensions and medical benefits, while government programs upon which they depend, such as Medicare and Medicaid, are becoming less generous. Robert K. Merton, the sociologist and father of a Nobel Prize winning economist, writing in the context of the accumulation of scientific prestige by the elite, called attention to the “Matthew effect,” alluding to the biblical passage: “For to everyone who has will more be given, and he will have abundance but from him who has not even what he has will be taken away.”21 Today, we are witnessing an economic Matthew effect beyond what anybody could have imagined only a few decades earlier.

Whether the Piketty and Saez estimates are overstated or too conservative, I will leave for others to decide. No matter which estimate you prefer, nobody can deny that the business offensive has certainly paid off handsomely. Since the election of George W. Bush in 2000, the transfer of wealth and income has accelerated at an alarming rate.

Even that arch-free-marketeer, former Federal Reserve chairman, Alan Greenspan, was moved to express concern about the extent of inequality in the United States today, admitting to Senator Jack Reed, “I think that the effective increase in the concentration of incomes here, which is implicit in this, is not desirable in a democratic society.”22 Admittedly, one might question the chairman’s sincerity considering his preferred remedies. For example, in response to a question about Social Security from Senator Schumer at a hearing before the same Senate committee a few months later, Greenspan responded, “I’ve been concerned about the concentration of income and wealth in this nation…and this [meaning the privatization of Social Security], in my judgment, is one way in which you can address this particular question.”23 Here is a more genuine expression of concern from Warren Buffett, perennially the second richest person in the world regarding the excessive tax cuts:

Corporate income taxes in fiscal 2003 accounted for 7.4 percent of all federal tax receipts, down from a post-war peak of 32 percent in 1952. With one exception (1983), last year’s percentage is the lowest recorded since data was first published in 1934….Tax breaks for corporations (and their investors, particularly large ones) were a major part of the Administration’s 2002 and 2003 initiatives. If class warfare is being waged in America, my class is clearly winning.24

Buffett’s figures actually overstate the corporate tax contribution. In fact, the Federal Reserve System—the purpose of which is supposed to be the public welfare, not profits—paid 16 percent of all corporate income taxes in 2002.25 Of those real corporations, many of the largest pay no taxes whatsoever. A fair number of these large corporations even pay negative taxes.

One study of 275 profitable Fortune 500 corporations with total U.S. profits of $1.1 trillion over the three-year period, 2001 through 2003, found that 82 of these corporations:

…paid zero or less in federal income taxes in at least one year from 2001 to 2003. Many of them enjoyed multiple no-tax years. In the years they paid no income tax, these companies reported $102 billion in pretax U.S. profits. But instead of paying $35.6 billion in income taxes as the statutory 35 percent corporate tax rate seems to require, these companies generated so many excess tax breaks that they received outright tax rebate checks from the U.S. Treasury, totaling $12.6 billion. These companies’ “negative tax rates” meant that they made more after taxes than before taxes in those no-tax years.25

Twenty-eight of these companies had a negative tax rate over the entire three-year period. The report continues, suggesting that the inequities are getting worse year by year:

In 2003 alone, 46 companies paid zero or less in federal income taxes. These 46 companies, almost one out of six of the companies in the study, reported U.S. pretax profits in 2003 of $42.6 billion, yet received tax rebates totaling $5.4 billion. In 2002, almost as many companies, 42, paid no tax, reporting $43.5 billion in pretax profits, but $4.9 billion in tax rebates. From 2001 to 2003, the number of no-tax companies jumped from 33 to 46, an increase of 40 percent.26

Putting this erosion of corporate taxes into perspective, the authors conclude:

Corporate taxes paid for more than a quarter of federal outlays in the 1950s and a fifth in the 1960s. They began to decline during the Nixon administration, yet even by the second half of the 1990s, corporate taxes still covered 11 percent of the cost of federal programs. But in fiscal 2002 and 2003, corporate taxes paid for a mere 6 percent of our government’s expenses.27

A follow-up study showed that the erosion of taxes on the state level was even more extreme.28

Gaining a perspective on the extent of the effect of cuts in personal income taxes may be easier. In 2005, President Bush was campaigning to make his tax cuts permanent. If he succeeds, the benefits for the top 1 percent of the population over the following seventy-five years will amount to an estimated $2.9 trillion.29 In other words, the tax cuts for this small segment of the population over this period would equal about one-quarter of the current annual GDP of the United States.

The lethal combination of tax cuts for the rich and the growing burdens on the poor threaten to annihilate what is left of social mobility. In the words of Thomas Piketty, mentioned earlier for his startling work on income inequality:

These new high-income tax cuts, together with all the previous tax cuts (including the repeal of the estate tax), will eventually contribute to rebuild a class of rentiers in the U.S., whereby a small group of wealthy but untalented children controls vast segments of the U.S. economy and penniless, talented children simply can’t compete….If such a tax policy is maintained, there is a decent probability that the U.S. will look like Old Europe prior to 1914 in a couple of generations.30

I do not mean to imply that the right wing is totally indifferent about people not carrying their share of the tax burden. Without betraying a trace of irony, a famous Wall Street Journal editorial wailed about “the non-taxpaying class,” complaining about the “lucky duckies.”31

The lucky duckies in question were those people who were too poor to make enough to pay taxes, not the affluent beneficiaries of the right-wing revolution. And what a revolution it was! Even if we correct for population growth and transfer payments, while ignoring all the reasons why the gains of the wealthy may be an understatement, we can safely say that the right-wing revolution still represents the largest transfer of wealth and income in the history of the world—far larger than what occurred during either the Russian or Chinese revolutions. After all, neither China nor China nor Russia had an economy that came anywhere near $7 trillion, the amount by which the annual U.S. GDP grew between 1970 and 2002.

In terms of wealth, the differences are far more extreme because creating an annual income flow requires a much greater level of wealth, comparable to the difference between the annual rent of a house and its purchase price. Government policies continue to promote an even more extreme redistribution of wealth and income to the rich. Most economists manage to turn a blind eye or to make an effort to explain those policies as necessary to create jobs or to make the economy more productive. The short-term victory in capturing virtually all of the growth of wealth and income while shedding tax obligations may seem like cause for jubilation—at least within some circles—but this victory may turn out to be hollow, even for those at the top of the pyramid. The right-wing revolution is ruthlessly pursuing policies that are undermining education, health care, and virtually every other public institution that supports the economy in an effort to extract more surplus value from ordinary people. In the process, the right wing is undermining the very foundation of the economy.

Notes

  1. President of the United States, Economic Report of the President (Washington, D.C.: GPO, 2005), table B-2, 286.
  2. President of the United States, Economic Report of the President (Washington, D.C.: GPO, 2004), table B-47, 340.
  3. Thomas Piketty & Emmanuel Saez, “Income Inequality in the United States, 1913–1998,” in Anthony B. Atkinson & T. Piketty, eds., Top Incomes Over the Twentieth Century: A Contrast Between the European and English Speaking Countries (Oxford: Oxford University Press, forthcoming), http://emlab.berkeley.edu/users/saez/piketty-saezOUP04US.pdf; see also David Cay Johnston, Perfectly Legal (New York: Portfolio, 2003), 38–39; and Paul Krugman, “For Richer,” New York Times Magazine (October 20, 2002).
  4. Lucian Bebchuk & Yaniv Grinstein, “The Growth of Executive Pay,” Oxford Review of Economic Policy 21, no. 2 (2005), http://www.law.harvard.edu/faculty/bebchuk/pdfs/Bebchuk-
    Grinstein.Growth-of Pay.pdf.
  5. Richard M. Titmuss, Income Distribution and Social Change (London: Allen & Unwin, 1962), 22.
  6. Johnston, Perfectly Legal.
  7. Max B. Sawicky, “Do-It-Yourself Tax Cuts: The Crisis in U.S. Tax Enforcement.” Economic Policy Institute Briefing Paper No. 160 (April 12, 2005), http://www.epinet.org/content.cfm/bp160.
  8. Nick Mathiason, “Super-Rich Hide Trillions Offshore.” The Observer (March 27, 2005).
  9. Joseph M. Dodge & Jay A. Soled, “Inflated Tax Basis and the Quarter-Trillion-Dollar Revenue Question,” Tax Notes 106, no. 4 (January 24, 2005).
  10. Johnston, Perfectly Legal, 129ff.
  11. Johnston, Perfectly Legal, 62.
  12. Nell Minow, “The Use of Company Aircraft,” http://www.thecorporatelibrary.com/special/misc/aircraft.html; Bryan Burrough & John Helyar,Barbarians at the Gate (New York: Harper and Row, 1990), 94; Gary Strauss, “Pricey Perk Lets Executives Fly High,” USA Today (August 5, 2003).
  13. David Yermack, “Flights of Fancy” (September 2004), http://public.kenan-flagler.unc.edu/faculty/shivdasani/
    uncduke%20corporate%20finance/
    David_Yermack_Aircraft0904.pdf.
  14. Mark Maremont, “Frequent Fliers: Amid Crackdown, the Jet Perk Suddenly Looks a Lot Pricier For CEOs,” Wall Street Journal, May 25, 2005.
  15. Joseph E. Stiglitz, The Roaring Nineties (New York: W. W. Norton, 2004).
  16. Gretchen Morgenson, “Only the Little People Pay for Lawn Care,” New York Times (May 1, 2005).
  17. Organisation for Economic Co-operation and Development, Clocking In and Clocking Out (October 2004), Clock in clock out.
  18. Kathy Chu, “Rising Bank Fees Hit Consumers,” USA Today (October 4, 2005); Dean Foust, “Protection” Racket?: As Overdraft and Other Fees Become Huge Profit Sources For Banks, Critics See Abuses,” Business Week (May 2, 2005).
  19. Piketty & Saez, “Income Inequality in the United States” see also Krugman, “For Richer.”
  20. Edward N. Wolff, “Changes in Household Wealth in the 1980s and 1990s in the U.S.” Levy Economics Institute Working Paper No 407 (May 2004).
  21. Robert K. Merton, “The Matthew Effect in Science,” Science 159, no. 3810 (January 5, 1968): 56–63.
  22. Senate Banking, Housing and Urban Affairs Committee, Federal Reserve’s Second Monetary Policy Report for 2004, 108th Congress, 2nd sess., July 20, 2004.
  23. Senate Banking, Housing and Urban Affairs Committee, Federal Reserve’s First Monetary Policy Report for 2005, 109th Congress, 1st sess., February 16, 2005.
  24. Warren Buffett, “Annual Letter to the Shareholders of Berkshire Hathaway Inc,” http://www.berkshirehathaway.com/letters/2003ltr.pdf.
  25. United States Department of Commerce, Bureau of Economic Analysis, National Income and Product Accounts, “Table 3.2. Federal Government Current Receipts and Expenditures” (2004), http://www.bea.gov/bea/dn/nipaweb/TableView.asp#Mid.
  26. Robert S. McIntyre & T. D. Coo Nguyen, Corporate Income Taxes in the Bush Years, (Washington, D.C.: Citizens for Tax Justice, Institute on Taxation and Economic Policy, 2004), http://www.ctj.org/corpfed04pr.pdf.
  27. McIntyre & Nguyen, Corporate Income Taxes in the Bush Years.
  28. Robert S. McIntyre & T. D. Coo Nguyen, Corporate Tax Avoidance in the States Even Worse Than Federal (Citizens for Tax Justice: Institute on Taxation and Economic Policy, 2005), http://www.ctj.org/pdf/corp0205an.pdf.
  29. Richard Kogan & Robert Greenstein, “President Portrays Social Security Shortfall as Enormous, but his Tax Cuts and Drug Benefit Will Cost at Least Five Times as Much,” Center on Budget and Policy Priorities (February 11, 2005), http://www.cbpp.org/1-4-05socsec.htm.
  30. Daniel Altman, “Efficiency and Equity (In the Same Breath),” New York Times, April 20, 2003.
  31. Wall Street Journal, “The Non-Taxpaying Class,” November 20, 2002.
2006, Volume 58, Issue 03 (July-August)
Comments are closed.