Skip to content
Home
About
The Editors
The Paul A. Baran—Paul M. Sweezy Memorial Award
Privacy Policy
Magazine
__________
Subscribe
Back Issues
Archives
__________
Submit an Article
My MR Subscription Account
My MR Press Store Account
Contact
Press
Help
Donate
MR Online
SEARCH
Home
About
The Editors
The Paul A. Baran—Paul M. Sweezy Memorial Award
Privacy Policy
Magazine
__________
Subscribe
Back Issues
Archives
__________
Submit an Article
My MR Subscription Account
My MR Press Store Account
Contact
Press
Help
Donate
MR Online
Close Menu
Books
Authors
On The Site
Also in this issue
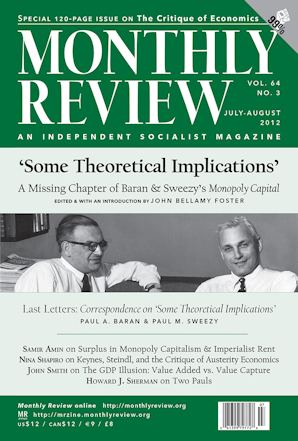
Introduction to Special Issue on the Critique of Economics
A Missing Chapter of Monopoly Capital: Introduction to Baran and Sweezy's 'Some Theoretical Implications'
Some Theoretical Implications
Last Letters: Correspondence on "Some Theoretical Implications"
The Surplus in Monopoly Capitalism and the Imperialist Rent
Keynes, Steindl, and the Critique of Austerity Economics
Two Pauls
Books by John Smith
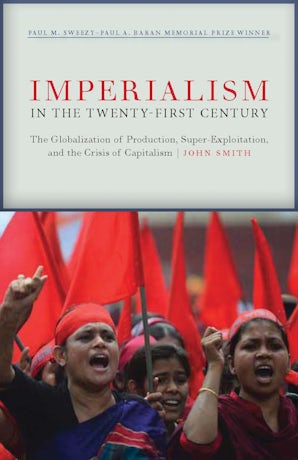
Imperialism in the Twenty-First Century
by John Smith
Article by John Smith
Imperialism in the Twenty-First Century